Historic Seven-Unit Apartment
For Sale
$1,450,000
Pending
210 Delaware Ave, Ithaca, NY 14850
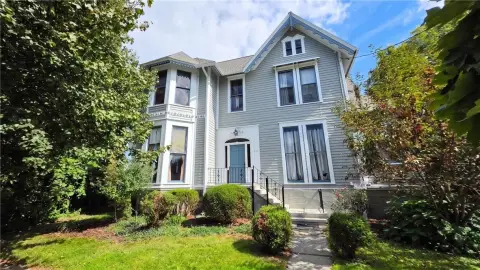
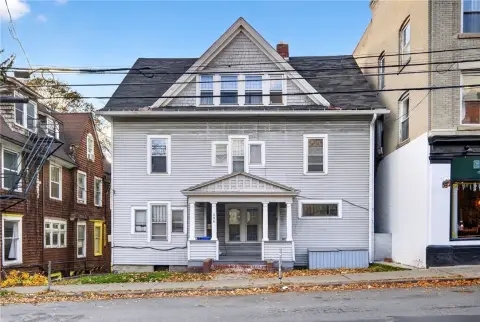
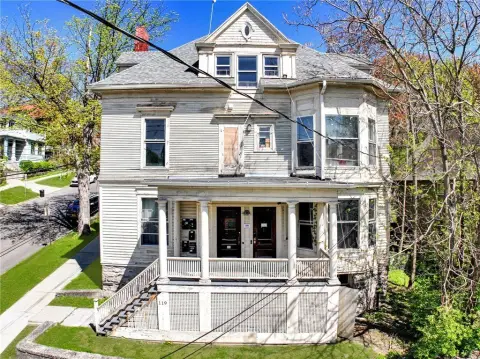
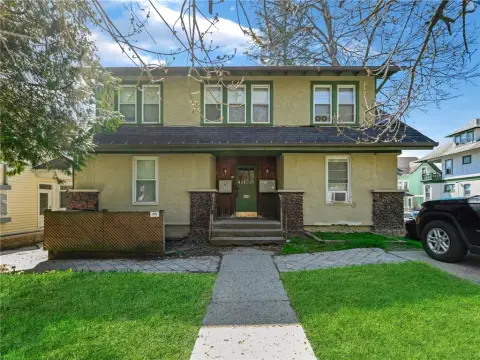
Seven-apartment building totaling 19 bedrooms, with recent window replacements and porch repairs.
Property Size8,018 SF
Days on Market109
Property Features for 210 Delaware Ave
General Information
Standard status
Pending
Size
8,018 SF
Property subtype
Residential Income
Additional Details
Multifamily Units
7
Taxes and HOA fees
Annual Taxes
$26,322
Listing Agency:
Berkshire Hathaway HomeServices Heritage Realty
(607) 428-0708
Listed By:
Brian DeYoung
(607) 275-1234
Source:
Exprealty
Added: Jun 24
Changed: Sep 9
Last Checked: Oct 9 at 11:54PM
Displayed information is deemed reliable but is not guaranteed and should be independently verified. All listing content including descriptions, pricing, images are the copyrighted material of Berkshire Hathaway HomeServices Heritage Realty
Investment Insights
Based on property information with market context.
This historic seven-unit apartment building features stained-glass windows, hardwood floors, and spacious apartment layouts. The property totals 19 bedrooms across seven units, with Unit 1–4 offering 3 bedrooms each; Unit 5 offering 4 bedrooms and 2 baths; Unit 6 offering 2 bedrooms; and Unit 7 offering 1 bedroom. Recent improvements include new windows throughout most of the building (excluding the original stained-glass windows), repairs to the double front porches with recent roof work on the right-side porch, and additional maintenance updates. Several units also include remodeled kitchens.
Located at 210 Delaware Avenue in Ithaca, the building sits just above the heart of Collegetown, with convenient access to Cornell University, restaurants, and amenities. The property’s setting is described as avoiding much of the area’s busiest foot traffic. Additional context provided: Dryden Rd to Bryant Ave to Delaware Ave.
Located at 210 Delaware Avenue in Ithaca, the building sits just above the heart of Collegetown, with convenient access to Cornell University, restaurants, and amenities. The property’s setting is described as avoiding much of the area’s busiest foot traffic. Additional context provided: Dryden Rd to Bryant Ave to Delaware Ave.
Key Highlights
- Seven‑unit rental property built in 1900 with 19 total bedrooms across all apartments
- Unit mix includes four 3‑bedroom units, one 4‑bedroom unit with 2 baths, one 2‑bedroom unit, and one 1‑bedroom unit
- Recent improvements include new windows throughout most of the building (excluding the original stained‑glass windows)
Financial Insights
Estimated NOI and Cap Rate
NOI / Yr
$98,351
Cap Rate
6.78%
Suggested Prices Based on Cap Rates
Cap Rate 5%
$1,967,020
$2.0M
Cap Rate 7%
$1,405,014
$1.4M
Cap Rate 9%
$1,092,789
$1.1M
Market Conditions
NOI Build-Up for 8,018 SF
Gross rent
$186.7K $23.28/SF
− Vacancy
−$7.8K −$0.98/SF
EGI
$178.8K $22.30/SF
− OpEx
−$80.5K −$10.04/SF
NOI
$98.4K $12.27/SF
Area
Tompkins County, NY
Vacancy
4.20%
Lease Rate
$23.28 /SF/Yr
Expense Ratio
45.00%
Simulate Cap Rate and NOI
Suggested Prices Based on Cap Rates
Cap Rate 5%
$1,967,020
Cap Rate 7%
$1,405,014
Cap Rate 9%
$1,092,789
Alternative Uses
Best Use
Apartment 5plus
$1.41M
$1.23M – $1.64M
NOI $98,351 @ 7.0% cap · market cap 6.78%
Second Best
—
—
no second resolved use
Theoretical Best
Office A
$2.50M
$2.19M – $2.92M
NOI $175,138 @ 7.0% cap · market cap 12.08%
Zoning and permitted uses should be independently verified with authorities.
Property Analytics
Unlock full access to Insights
Subscribe to Realmo Intelligence
Open Analytics
Current Use
Lease Details
7
Residential units
Location Intelligence
Trade Area within ½ mile
951
Businesses Nearby
Explore this area
Business Placement
Demographics for 14850, NY
69,271
Population
31,772
Households
2.2
Avg Household Size
29
Median Age
72%
College-Educated
96%
High-School Grad
124.8 sq mi
ZIP Area
555
Density / Sq Mi
$69,689
Median Household Income
$36,115
Median Earnings
$1,446
Median Rent
$334,800
Median Home Value
Check the figures for this property
Cap Rate, Value Estimation, Potential NOI and more
View Realmo Analytics
Market
Vacancy Rate% for Multifamily in Northeast region

Questions? Ask Rey
Realmo’s AI knows this listing — price, zoning, demand, history. Ask anything.





Frequently Asked Questions
What type of property is this?
Apartment building - Seven-apartment building totaling 19 bedrooms, with recent window replacements and porch repairs.
Where is this apartment building located?
The property is located at 210 Delaware Ave Ithaca, NY.
What is the asking price?
The asking price for this property is $1,450,000.
What are key features of this property?
This property features: Seven‑unit rental property built in 1900 with 19 total bedrooms across all apartments; Unit mix includes four 3‑bedroom units, one 4‑bedroom unit with 2 baths, one 2‑bedroom unit, and one 1‑bedroom unit; Recent improvements include new windows throughout most of the building (excluding the original stained‑glass windows)


