Renovated Historic
For Sale
$3,000,000
21 Main Street TITUSVILLE, Titusville, FL 32796
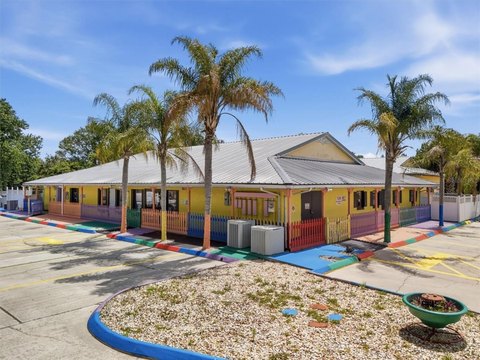
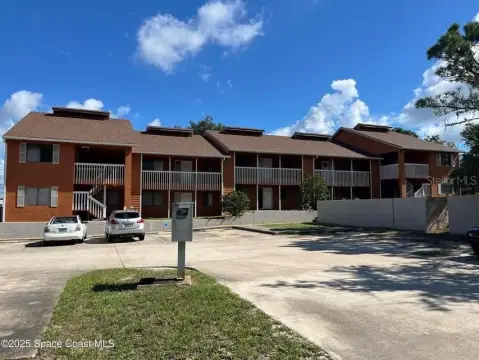
Two-building, historic quadplex with fully remodeled upstairs apartments and month-to-month tenants, offered with multiple modern building systems.
Property Size16,470 SF
Price / SF$216.45
Days on Market99
Property Features for 21 Main Street TITUSVILLE
General Information
Standard status
Active
Size
16,470 SF
Zoning
CBD
Additional Details
Multifamily Units
4
Taxes and HOA fees
Annual Taxes
$12,054
Amenities
2
true
10019
0.23
false
Asphalt
Block
Business District,City Street
16470
Building Details
Building Size
16,470 SF
Year Built
1924
Buildings
2
Stories
2
Tenancy
Multi
Listed By:
Anna Hunter
(407) 656-7814
Source:
Therealestatecollection
Added: Jul 7
Changed: Sep 23
Last Checked: Oct 7 at 10:00AM
Displayed information is deemed reliable but is not guaranteed and should be independently verified. All listing content including descriptions, pricing, images are the copyrighted material of Anna Hunter
Investment Insights
Based on property information with market context.
This renovated, over-100-year-old residential income property is presented as a two-building site designed with four upstairs apartments. Each building provides two apartments and has been renovated throughout, including updated lighting and electrical, roof work, new flooring, and interior and exterior painting. Mechanical and envelope improvements include six AC units, replaced windows in 2020, and brick that has been painted and sealed. The property has also been tented for termites, and both buildings are handicap accessible from the back.
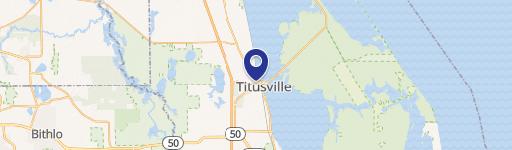
The offering includes 21 Main Street with 1st floor space and 2nd floor space totaling 13,776 SF, along with 25 Main Street totaling 2,694 SF. The buildings are located in the heart of Titusville, Florida, and each unit is positioned as a fully remodeled upstairs apartment.
For buyers seeking a residential income asset, this configuration can appeal to an owner-operator or investor who wants turnkey interiors and an income stream supported by month-to-month tenants already in place. The back-access handicap accessibility and the list of recent building upgrades may reduce near-term capital concerns while providing a practical layout for continued rental operations.
The offering includes 21 Main Street with 1st floor space and 2nd floor space totaling 13,776 SF, along with 25 Main Street totaling 2,694 SF. The buildings are located in the heart of Titusville, Florida, and each unit is positioned as a fully remodeled upstairs apartment.
For buyers seeking a residential income asset, this configuration can appeal to an owner-operator or investor who wants turnkey interiors and an income stream supported by month-to-month tenants already in place. The back-access handicap accessibility and the list of recent building upgrades may reduce near-term capital concerns while providing a practical layout for continued rental operations.
Key Highlights
- Historic 2‑building site in Titusville built in 1924 with asphalt city street frontage.
- Renovated throughout: lighting, electrical, roof, flooring, and interior/exterior painting, plus brick painted and sealed.
- Windows replaced in 2020; building has been tented for termites.
Financial Insights
Estimated NOI and Cap Rate
NOI / Yr
$157,842
Cap Rate
5.26%
Suggested Prices Based on Cap Rates
Cap Rate 5%
$3,156,840
$3.2M
Cap Rate 7%
$2,254,886
$2.3M
Cap Rate 9%
$1,753,800
$1.8M
Market Conditions
NOI Build-Up for 13,860 SF
Gross rent
$241.2K $17.40/SF
− Vacancy
−$15.7K −$1.13/SF
EGI
$225.5K $16.27/SF
− OpEx
−$67.6K −$4.88/SF
NOI
$157.8K $11.39/SF
Area
Brevard County, FL
Vacancy
6.50%
Lease Rate
$17.40 /SF/Yr
Expense Ratio
30.00%
Simulate Cap Rate and NOI
Suggested Prices Based on Cap Rates
Cap Rate 5%
$3,156,840
Cap Rate 7%
$2,254,886
Cap Rate 9%
$1,753,800
Alternative Uses
Best Use
Multifamily LT 5
$2.25M
$1.97M – $2.63M
NOI $157,842 @ 7.0% cap · market cap 5.26%
Second Best
Apartment 5plus
$2.03M
$1.77M – $2.36M
NOI $141,879 @ 7.0% cap · market cap 4.73%
Theoretical Best
Office A
$3.66M
$3.20M – $4.27M
NOI $255,966 @ 7.0% cap · market cap 8.53%
Zoning and permitted uses should be independently verified with authorities.
How Realmo checks its estimates
Property Analytics
Unlock full access to Insights
Subscribe to Realmo Intelligence
Open Analytics
Current Use
Lease Details
4
Residential units
Multi-tenant
Tenancy
Location Intelligence
Trade Area within ½ mile
1,094
Businesses Nearby
Explore this area
Business Placement
Demographics for 32796, FL
20,818
Population
9,670
Households
2.2
Avg Household Size
50
Median Age
28%
College-Educated
90%
High-School Grad
14.4 sq mi
ZIP Area
1,446
Density / Sq Mi
$67,399
Median Household Income
$40,368
Median Earnings
$1,305
Median Rent
$243,700
Median Home Value
Check the figures for this property
Cap Rate, Value Estimation, Potential NOI and more
View Realmo Analytics
Market
Vacancy Rate% for Multifamily in South region

Questions? Ask Rey
Realmo’s AI knows this listing — price, zoning, demand, history. Ask anything.






Frequently Asked Questions
What type of property is this?
Quadplex - Two-building, historic quadplex with fully remodeled upstairs apartments and month-to-month tenants, offered with multiple modern building systems.
Where is this quadplex located?
The property is located at 21 Main Street TITUSVILLE Titusville, FL.
What is the asking price?
The asking price for this property is $3,000,000.
What are key features of this property?
This property features: Historic 2‑building site in Titusville built in 1924 with asphalt city street frontage.; Renovated throughout: lighting, electrical, roof, flooring, and interior/exterior painting, plus brick painted and sealed.; Windows replaced in 2020; building has been tented for termites.


