Freestanding Office
For Sale
Contact for pricing
2084 Valleydale Road, Birmingham, AL 35244
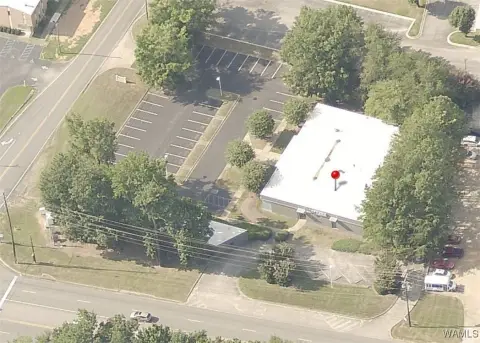
A 6,600 SF freestanding building on 1.9 acres with high-visibility frontage along a heavily traveled corridor.
Property Size6,600 SF
Lot Size1.90 Acres
Price / SF$212.12
Days on Market145
Property Features for 2084 Valleydale Road
General Information
Standard status
Active
Size
6,600 SF
Class
B
Total Parking Spaces
76
Lot size
1.90 Acres
Property subtype
Special Purpose, Office
Investment Type
Owner/User
Site & Location
Traffic Count
21,000 vehicles/day
Highway Access
Yes
Building Details
Year Built
1978
Buildings
1
Units
76
Listing Agency:
Lightpoint
Listed By:
Kyle Church · License #AL 000124859 - 1
(205) 919-1528
Source:
Crexi
Added: Jun 2
Changed: Oct 19
Last Checked: Oct 23 at 7:24AM
Displayed information is deemed reliable but is not guaranteed and should be independently verified. All listing content including descriptions, pricing, images are the copyrighted material of Lightpoint

Ask AI about this property
Review the available facts, identify missing information and prepare questions for the agent.
Investment Insights
Based on property information with market context.
This freestanding office building totals 6,600 SF and is situated on approximately 1.9 acres. The property is positioned for flexible use, with straightforward adaptability for medical, office, or other professional applications.
The site benefits from strong frontage along highly traveled Valleydale Road, with traffic counts exceeding 21,000 vehicles per day. It also offers convenient regional access to I-65, Highway 31, and Highway 119, supporting a broad range of customer and employee commuting patterns.
For prospective tenants, buyers, or owner-occupants, the building’s size and professional conversion potential can align with medical practices, office users, or other service-oriented operations seeking a visible, accessible site. The overall configuration and corridor access may be especially useful for organizations that value day-to-day access and clear site presence for clients and visitors.
The site benefits from strong frontage along highly traveled Valleydale Road, with traffic counts exceeding 21,000 vehicles per day. It also offers convenient regional access to I-65, Highway 31, and Highway 119, supporting a broad range of customer and employee commuting patterns.
For prospective tenants, buyers, or owner-occupants, the building’s size and professional conversion potential can align with medical practices, office users, or other service-oriented operations seeking a visible, accessible site. The overall configuration and corridor access may be especially useful for organizations that value day-to-day access and clear site presence for clients and visitors.
Key Highlights
- 6,600 SF freestanding building on 1.9 acres along Valleydale Road
- High‑visibility frontage with traffic counts exceeding 21,000 vehicles per day
- Year built: 1978
Financial Insights
Estimated NOI and Cap Rate
NOI / Yr
$79,269
Cap Rate
5.66%
Suggested Prices Based on Cap Rates
Cap Rate 5%
$1,585,380
$1.6M
Cap Rate 7%
$1,132,414
$1.1M
Cap Rate 9%
$880,767
$880.8K
Market Conditions
NOI Build-Up for 6,600 SF
Gross rent
$134.6K $20.40/SF
− Vacancy
−$28.9K −$4.39/SF
EGI
$105.7K $16.01/SF
− OpEx
−$26.4K −$4.00/SF
NOI
$79.3K $12.01/SF
Area
Birmingham, AL
Vacancy
21.50%
Lease Rate
$20.40 /SF/Yr
Expense Ratio
25.00%
Simulate Cap Rate and NOI
Suggested Prices Based on Cap Rates
Cap Rate 5%
$1,585,380
Cap Rate 7%
$1,132,414
Cap Rate 9%
$880,767
Alternative Uses
Best Use
Office B
$1.13M
$990.9K – $1.32M
NOI $79,269 @ 7.0% cap · market cap 5.66%
Second Best
—
—
no second resolved use
Theoretical Best
Office A
$1.55M
$1.36M – $1.81M
NOI $108,441 @ 7.0% cap · market cap 7.75%
Zoning and permitted uses should be independently verified with authorities.
How Realmo checks its estimates
Property Analytics
Who owns this building?
See the owner, sales and loan history
Open Analytics
Current Use
Lease Details
21,000 VPD
Traffic count
Yes
Highway access
Location Intelligence
Trade Area within ½ mile
568
Businesses Nearby
Explore this area
Business Placement
Demographics for 35244, AL
37,448
Population
15,189
Households
2.5
Avg Household Size
39
Median Age
60%
College-Educated
97%
High-School Grad
23.9 sq mi
ZIP Area
1,567
Density / Sq Mi
$114,172
Median Household Income
$61,660
Median Earnings
$1,413
Median Rent
$390,900
Median Home Value
Check the figures for this property
Cap Rate, Value Estimation, Potential NOI and more
View Realmo Analytics
Market
Vacancy Rate% for Office in Birmingham, AL




Frequently Asked Questions
What type of property is this?
Office building - A 6,600 SF freestanding building on 1.9 acres with high-visibility frontage along a heavily traveled corridor.
Where is this office building located?
The property is located at 2084 Valleydale Road Birmingham, AL.
What is the asking price?
The asking price for this property is $1,400,000.
What are key features of this property?
This property features: 6,600 SF freestanding building on 1.9 acres along Valleydale Road; High‑visibility frontage with traffic counts exceeding 21,000 vehicles per day; Year built: 1978


