First-Floor Office with Reception
For Sale
$849,000
206 E Liberty St, Milford, MI 48381
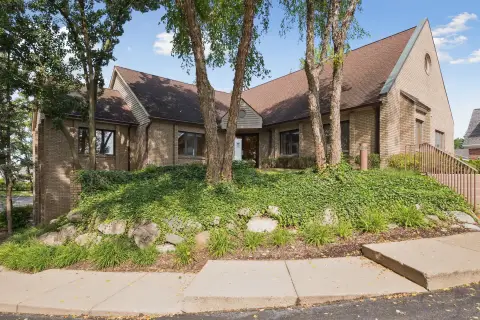
A first-floor office with an open reception and waiting room above two residential units in Milford Village.
Property Size4,800 SF
Price / SF$176.88
Days on Market143
Property Features for 206 E Liberty St
General Information
Standard status
Active
Size
4,800 SF
Property subtype
Commercial
Units
Multifamily Units
2
Office Units
1
Building Details
Year Built
2001
Stories
2
Listing Agency:
RE/MAX Platinum-Hartland
Listed By:
John E Luke · License #6501229646
(810) 691-2142
Source:
Vmrealestatemichigan
Added: Jun 4
Changed: Oct 1
Last Checked: Oct 23 at 7:50AM
Displayed information is deemed reliable but is not guaranteed and should be independently verified. All listing content including descriptions, pricing, images are the copyrighted material of RE/MAX Platinum-Hartland

Ask AI about this property
Review the available facts, identify missing information and prepare questions for the agent.
Investment Insights
Based on property information with market context.
This mixed-use building combines a first-floor office with a residential component on the second floor. The ground level is set up with an open reception and waiting room, supported by a trim package and decor described as luxury. The second floor consists of two high-end residential units, providing a clear vertical split between professional and residential space. The first-floor office area is stated as over 200 square feet.
Located in the busy Milford Village area, the building is described as only a half-block walk to the center of Milford Village. Bicycle and walkability metrics are provided with a BikeScore of 40 (somewhat bikeable) and a WalkScore of 56 (somewhat walkable), supporting day-to-day convenience for visitors and residents.
For an owner-occupant or a small office user looking to separate work and living, the layout offers a dedicated office entry footprint with a reception and waiting area, while the two residential units can support additional income. Prospective buyers and brokers will find the configuration straightforward: office space on the first floor and two residential units on the second floor, all within a compact Milford Village setting.
Located in the busy Milford Village area, the building is described as only a half-block walk to the center of Milford Village. Bicycle and walkability metrics are provided with a BikeScore of 40 (somewhat bikeable) and a WalkScore of 56 (somewhat walkable), supporting day-to-day convenience for visitors and residents.
For an owner-occupant or a small office user looking to separate work and living, the layout offers a dedicated office entry footprint with a reception and waiting area, while the two residential units can support additional income. Prospective buyers and brokers will find the configuration straightforward: office space on the first floor and two residential units on the second floor, all within a compact Milford Village setting.
Key Highlights
- Year built 2001 mixed‑use building in Milford Village
- Over 200 SF first‑floor office with open reception and waiting room
- First floor includes luxury office trim package and decor
Financial Insights
Estimated NOI and Cap Rate
NOI / Yr
$63,534
Cap Rate
7.48%
Suggested Prices Based on Cap Rates
Cap Rate 5%
$1,270,680
$1.3M
Cap Rate 7%
$907,629
$907.6K
Cap Rate 9%
$705,933
$705.9K
Market Conditions
NOI Build-Up for 4,800 SF
Gross rent
$95.0K $19.80/SF
− Vacancy
−$4.3K −$0.89/SF
EGI
$90.8K $18.91/SF
− OpEx
−$27.2K −$5.67/SF
NOI
$63.5K $13.24/SF
Area
Oakland County, MI
Vacancy
4.50%
Lease Rate
$19.80 /SF/Yr
Expense Ratio
30.00%
Simulate Cap Rate and NOI
Suggested Prices Based on Cap Rates
Cap Rate 5%
$1,270,680
Cap Rate 7%
$907,629
Cap Rate 9%
$705,933
Alternative Uses
Best Use
Multifamily LT 5
$907.6K
$794.2K – $1.06M
NOI $63,534 @ 7.0% cap · market cap 7.48%
Second Best
Apartment 5plus
$841.1K
$736.0K – $981.3K
NOI $58,878 @ 7.0% cap · market cap 6.93%
Theoretical Best
Specialty Retail
$1.04M
$905.9K – $1.21M
NOI $72,472 @ 7.0% cap · market cap 8.54%
Zoning and permitted uses should be independently verified with authorities.
How Realmo checks its estimates
Property Analytics
Unlock full access to Insights
Subscribe to Realmo Intelligence
Open Analytics
Current Use
Lease Details
1
Office units
2
Residential units
Location Intelligence
Trade Area within ½ mile
795
Businesses Nearby
Explore this area
Business Placement
Demographics for 48381, MI
13,794
Population
5,588
Households
2.5
Avg Household Size
45
Median Age
45%
College-Educated
96%
High-School Grad
19.5 sq mi
ZIP Area
707
Density / Sq Mi
$103,156
Median Household Income
$61,929
Median Earnings
$1,146
Median Rent
$386,800
Median Home Value
Check the figures for this property
Cap Rate, Value Estimation, Potential NOI and more
View Realmo Analytics
Market
Vacancy Rate% for Office in Midwest region




Frequently Asked Questions
What type of property is this?
Office unit - A first-floor office with an open reception and waiting room above two residential units in Milford Village.
Where is this office unit located?
The property is located at 206 E Liberty St Milford, MI.
What is the asking price?
The asking price for this property is $849,000.
What are key features of this property?
This property features: Year built 2001 mixed‑use building in Milford Village; Over 200 SF first‑floor office with open reception and waiting room; First floor includes luxury office trim package and decor