Updated Duplex With Daylight
For Sale
$779,000
2036-2038 Southeast Morrison Street, Portland, OR 97214
Two separately entered units offer flexible owner-occupant and rental configurations in Portland’s Buckman neighborhood.
Property Size2,315 SF
Price / SF$336.50
Days on Market869
Property Features for 2036-2038 Southeast Morrison Street
General Information
Standard status
Active
Size
2,315 SF
Property subtype
Multi Family
Zoning
CM2
Units
Unit Mix
1 x 3BD/1BA, 1 x 2BD/1BA
Multifamily Units
2
Taxes and HOA fees
Annual Taxes
$6,740
Amenities
Composition
Wood Siding
Building Details
Year Built
1909
Buildings
1
Listing Agency:
Kelly Right Real Estate of Portland, LLC
Listed By:
Jacob Serrill · License #201228311
(503) 780-7521
Source:
Compass
Added: May 31, 2024
Changed: Oct 11
Last Checked: Oct 16 at 10:52AM
Displayed information is deemed reliable but is not guaranteed and should be independently verified. All listing content including descriptions, pricing, images are the copyrighted material of Kelly Right Real Estate of Portland, LLC

Ask AI about this property
Review the available facts, identify missing information and prepare questions for the agent.
Investment Insights
Based on property information with market context.
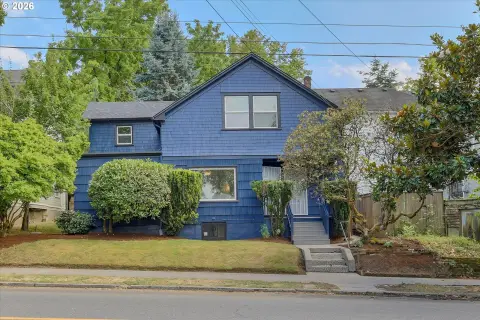
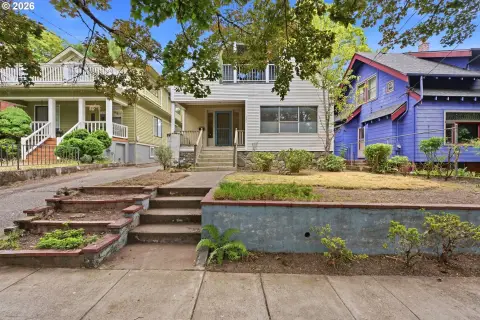
This updated duplex at 2036-2038 Southeast Morrison Street includes 2,315 square feet arranged as two independent residences. The main-level unit offers three bedrooms and one bathroom, while the daylight basement ADU includes two bedrooms and one bathroom. Each unit has its own entrance, kitchen, laundry, and electric meter. The property was built in 1909 and features composition roofing and wood siding.
Zoned CM2, the duplex is fully permitted for year-round rental use. Its Portland setting places the property near Belmont, Hawthorne, and central city amenities. The layout supports owner occupancy with a separate rental unit, leasing both residences, or use for longer-term rentals and short-term stays.
Zoned CM2, the duplex is fully permitted for year-round rental use. Its Portland setting places the property near Belmont, Hawthorne, and central city amenities. The layout supports owner occupancy with a separate rental unit, leasing both residences, or use for longer-term rentals and short-term stays.
Key Highlights
- 2,315 SF duplex with 5 bedrooms and 2 bathrooms
- 3BD/1BA main‑level unit plus 2BD/1BA daylight basement ADU
- Separate entrances, kitchens, laundry, and electric meters for each unit
Financial Insights
Estimated NOI and Cap Rate
NOI / Yr
$32,261
Cap Rate
4.14%
Suggested Prices Based on Cap Rates
Cap Rate 5%
$645,220
$645.2K
Cap Rate 7%
$460,871
$460.9K
Cap Rate 9%
$358,456
$358.5K
Market Conditions
NOI Build-Up for 2,315 SF
Gross rent
$48.6K $21.00/SF
− Vacancy
−$2.5K −$1.09/SF
EGI
$46.1K $19.91/SF
− OpEx
−$13.8K −$5.97/SF
NOI
$32.3K $13.94/SF
Area
Portland, OR
Vacancy
5.20%
Lease Rate
$21.00 /SF/Yr
Expense Ratio
30.00%
Simulate Cap Rate and NOI
Suggested Prices Based on Cap Rates
Cap Rate 5%
$645,220
Cap Rate 7%
$460,871
Cap Rate 9%
$358,456
Alternative Uses
Best Use
Multifamily LT 5
$460.9K
$403.3K – $537.7K
NOI $32,261 @ 7.0% cap · market cap 4.14%
Second Best
Apartment 5plus
$424.6K
$371.6K – $495.4K
NOI $29,725 @ 7.0% cap · market cap 3.82%
Theoretical Best
Office A
$650.1K
$568.9K – $758.5K
NOI $45,508 @ 7.0% cap · market cap 5.84%
Zoning and permitted uses should be independently verified with authorities.
How Realmo checks its estimates
Property Analytics
Current Use
Lease Details
2
Residential units
Location Intelligence
Trade Area within ½ mile
3,585
Businesses Nearby
Explore this area
Business Placement
Demographics for 97214, OR
28,403
Population
15,948
Households
1.8
Avg Household Size
36
Median Age
67%
College-Educated
98%
High-School Grad
2.9 sq mi
ZIP Area
9,794
Density / Sq Mi
$86,879
Median Household Income
$55,643
Median Earnings
$1,628
Median Rent
$733,200
Median Home Value
Market
Vacancy Rate% for Multifamily in West region




Frequently Asked Questions
What type of property is this?
Duplex - Two separately entered units offer flexible owner-occupant and rental configurations in Portland’s Buckman neighborhood.
Where is this duplex located?
The property is located at 2036-2038 Southeast Morrison Street Portland, OR.
What is the asking price?
The asking price for this property is $779,000.
What are key features of this property?
This property features: 2,315 SF duplex with 5 bedrooms and 2 bathrooms; 3BD/1BA main‑level unit plus 2BD/1BA daylight basement ADU; Separate entrances, kitchens, laundry, and electric meters for each unit


