Restaurant Building with Walk-In
For Sale
$349,900
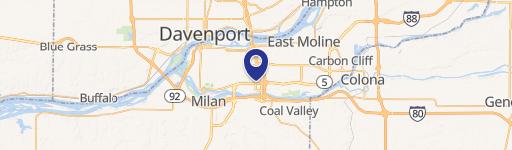
2036 16th St, Moline, IL 51265
Includes dining areas, bar-style seating, walk-in refrigeration, and on-site parking.
Property Size2,400 SF
Price / SF$145.79
Days on Market57
Property Features for 2036 16th St
General Information
Standard status
Active
Size
2,400 SF
Total Parking Spaces
60
Additional Details
Seating Capacity
150
Building Details
Year Built
1950
Listing Agency:
Cornerstone Partners QC - Real Broker, LLC
Listed By:
Michael Ingleby · License #B22012000/475.093175
(563) 340-7739
Source:
Bktchicago
Added: Aug 30
Changed: Oct 4
Last Checked: Oct 7 at 1:45PM
Displayed information is deemed reliable but is not guaranteed and should be independently verified. All listing content including descriptions, pricing, images are the copyrighted material of Cornerstone Partners QC - Real Broker, LLC

Ask AI about this property
Review the available facts, identify missing information and prepare questions for the agent.
Investment Insights
Based on property information with market context.
This Moline restaurant building includes approximately 150 seats arranged among booths and bar-style seating, along with a large walk-in cooler and separate walk-in freezer. The property also has dining, kitchen, and service areas, and the owners were working toward adding a pickup window. A patio was under consideration for the site.
The building is located at 2036 16th St beside Wharton Fieldhouse and Playground. Nearby businesses include Whitey's Ice Cream, Happy Joe's Pizza, and Country Style Ice Cream. On-site parking accommodates roughly 60 vehicles. The roof was replaced in 2000/2001.
The building is located at 2036 16th St beside Wharton Fieldhouse and Playground. Nearby businesses include Whitey's Ice Cream, Happy Joe's Pizza, and Country Style Ice Cream. On-site parking accommodates roughly 60 vehicles. The roof was replaced in 2000/2001.
Key Highlights
- Approximately 150 seats with booths and bar‑style seating
- Large walk‑in cooler and separate walk‑in freezer
- Roughly 60 on‑site parking spaces
Financial Insights
Estimated NOI and Cap Rate
NOI / Yr
$28,227
Cap Rate
8.07%
Suggested Prices Based on Cap Rates
Cap Rate 5%
$564,540
$564.5K
Cap Rate 7%
$403,243
$403.2K
Cap Rate 9%
$313,633
$313.6K
Market Conditions
NOI Build-Up for 2,400 SF
Gross rent
$38.9K $16.20/SF
− Vacancy
−$1.2K −$0.52/SF
EGI
$37.6K $15.68/SF
− OpEx
−$9.4K −$3.92/SF
NOI
$28.2K $11.76/SF
Area
Rock Island County, IL
Vacancy
3.20%
Lease Rate
$16.20 /SF/Yr
Expense Ratio
25.00%
Simulate Cap Rate and NOI
Suggested Prices Based on Cap Rates
Cap Rate 5%
$564,540
Cap Rate 7%
$403,243
Cap Rate 9%
$313,633
Alternative Uses
Best Use
Specialty Retail
$403.2K
$352.8K – $470.5K
NOI $28,227 @ 7.0% cap · market cap 8.07%
Second Best
—
—
no second resolved use
Theoretical Best
Healthcare Medical
$408.7K
$357.6K – $476.9K
NOI $28,611 @ 7.0% cap · market cap 8.18%
Zoning and permitted uses should be independently verified with authorities.
How Realmo checks its estimates
Property Analytics
Who owns this building?
See the owner, sales and loan history
Open Analytics
Current Use
Location Intelligence
Trade Area within ½ mile
470
Businesses Nearby
25k
Monthly Visits Nearby
Under-served
Demand for This Use
Explore this area
Business Placement
Foot Traffic Nearby
Dining 55%
Shops & Services 43%
Electronics 2%
Hardee's
Dining
7,473 visits/mo
0.3 miles
La Rancherita
Dining
4,801 visits/mo
0.2 miles
Conoco
Shops & Services
3,721 visits/mo
0.1 miles
BP
Shops & Services
2,894 visits/mo
0.3 miles
Super Wash
Shops & Services
2,551 visits/mo
0.2 miles
Check the figures for this property
Cap Rate, Value Estimation, Potential NOI and more
View Realmo Analytics
Market
Vacancy Rate% for Retail in Midwest region


Frequently Asked Questions
What type of property is this?
Conventional restaurant - Includes dining areas, bar-style seating, walk-in refrigeration, and on-site parking.
Where is this conventional restaurant located?
The property is located at 2036 16th St Moline, IL.
What is the asking price?
The asking price for this property is $349,900.
What are key features of this property?
This property features: Approximately 150 seats with booths and bar‑style seating; Large walk‑in cooler and separate walk‑in freezer; Roughly 60 on‑site parking spaces


