Flex Building with Office Flex
For Sale
Contact for pricing
2025 E 4th St, Lima, OH 45805
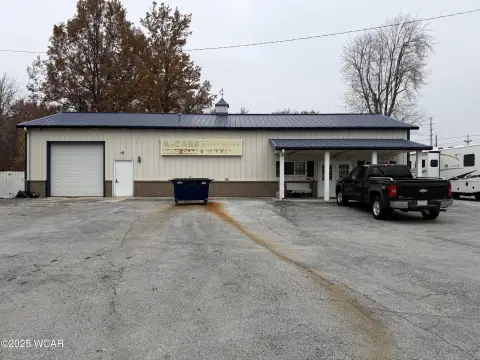
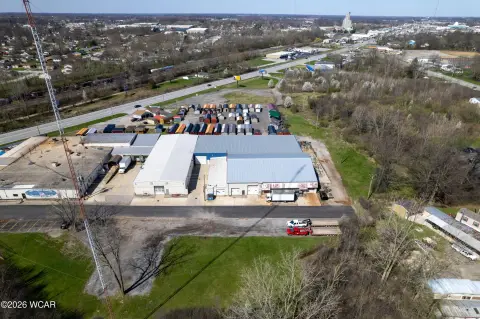
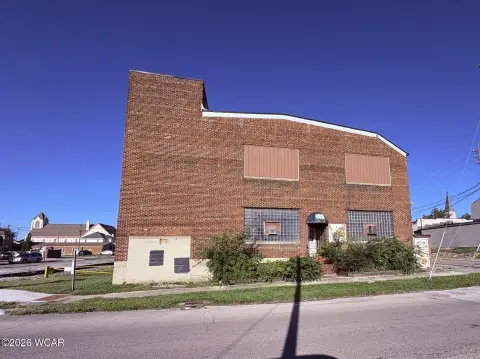
Includes 23,000 SF of office/flex space scheduled for availability in June 2025 with strong daily street visibility.
Property Size50,088 SF
Price / SF$56.90
Days on Market147
Property Features for 2025 E 4th St
General Information
Standard status
Active
Size
50,088 SF
Class
B
Property subtype
Office, Industrial
Zoning
Industrial
Occupancy
60%
Lease Type
Modified Gross
Net Operating Income
$101,544
Site & Location
Traffic Count
13,500 vehicles/day
Highway Access
Yes
Building Details
Year Built
1967
Tenancy
Multi
Listing Agency:
Dye Real Estate and Land Company
Listed By:
Garrett Gatton · License #2019005469
Source:
Crexi
Added: Jun 2
Changed: Oct 25
Last Checked: Oct 24 at 5:52PM
Displayed information is deemed reliable but is not guaranteed and should be independently verified. All listing content including descriptions, pricing, images are the copyrighted material of Dye Real Estate and Land Company

Ask AI about this property
Review the available facts, identify missing information and prepare questions for the agent.
Investment Insights
Based on property information with market context.
This for-sale flex building contains 50,088 SF total and offers 23,000 SF of office/flex space available in June 2025. The balance of the building is currently leased to established tenants, including Victress Health, S.S.O.E Inc., and Eagle Mark, generating $17,373 per month.
The property is located at 2025 E 4th St in Lima, Ohio, along I-75, positioned between Toledo and Dayton. It provides exceptional visibility on East 4th Street with 13,500+ vehicles daily, and it is situated near Eastgate’s hotels and restaurants.
For buyers and operators seeking a flexible commercial asset, the building supports a range of business uses described for the offering, including office, R&D, showroom, or warehouse/distribution. The available office/flex portion arriving in June 2025 can accommodate an expansion plan or a repositioning strategy while maintaining income from the currently leased space.
The property is located at 2025 E 4th St in Lima, Ohio, along I-75, positioned between Toledo and Dayton. It provides exceptional visibility on East 4th Street with 13,500+ vehicles daily, and it is situated near Eastgate’s hotels and restaurants.
For buyers and operators seeking a flexible commercial asset, the building supports a range of business uses described for the offering, including office, R&D, showroom, or warehouse/distribution. The available office/flex portion arriving in June 2025 can accommodate an expansion plan or a repositioning strategy while maintaining income from the currently leased space.
Key Highlights
- 50,088 SF flex building at 2025 E 4th St, built in 1967
- 23,000 SF of office/flex space scheduled for availability in June 2025
- Remaining space leased to established tenants: Victress Health, S.S.O.E Inc., and Eagle Mark 4
Financial Insights
Estimated NOI and Cap Rate
NOI / Yr
$205,821
Cap Rate
7.22%
Suggested Prices Based on Cap Rates
Cap Rate 5%
$4,116,420
$4.1M
Cap Rate 7%
$2,940,300
$2.9M
Cap Rate 9%
$2,286,900
$2.3M
Market Conditions
NOI Build-Up for 50,088 SF
Gross rent
$321.1K $6.41/SF
− Vacancy
−$27.0K −$0.54/SF
EGI
$294.0K $5.87/SF
− OpEx
−$88.2K −$1.76/SF
NOI
$205.8K $4.11/SF
Area
Allen County, OH
Vacancy
8.42%
Lease Rate
$6.41 /SF/Yr
Expense Ratio
30.00%
Simulate Cap Rate and NOI
Suggested Prices Based on Cap Rates
Cap Rate 5%
$4,116,420
Cap Rate 7%
$2,940,300
Cap Rate 9%
$2,286,900
Alternative Uses
Best Use
Office B
$9.07M
$7.93M – $10.58M
NOI $634,715 @ 7.0% cap · market cap 22.27%
Second Best
Flex RnD
$4.11M
$3.60M – $4.79M
NOI $287,655 @ 7.0% cap · market cap 10.09%
Theoretical Best
Office A
$12.06M
$10.56M – $14.08M
NOI $844,508 @ 7.0% cap · market cap 29.63%
Zoning and permitted uses should be independently verified with authorities.
How Realmo checks its estimates
Property Analytics
Unlock full access to Insights
Subscribe to Realmo Intelligence
Open Analytics
Current Use
Lease Details
13,500 VPD
Traffic count
Yes
Highway access
Location Intelligence
Trade Area within ½ mile
54
Businesses Nearby
Well-served
Demand for This Use
Explore this area
Business Placement
Demographics for 45805, OH
22,740
Population
10,560
Households
2.2
Avg Household Size
39
Median Age
24%
College-Educated
94%
High-School Grad
14.6 sq mi
ZIP Area
1,558
Density / Sq Mi
$65,954
Median Household Income
$37,126
Median Earnings
$944
Median Rent
$153,700
Median Home Value
Check the figures for this property
Cap Rate, Value Estimation, Potential NOI and more
View Realmo Analytics
Market
Vacancy Rate% for Office in Midwest region





Frequently Asked Questions
What type of property is this?
Flex space - Includes 23,000 SF of office/flex space scheduled for availability in June 2025 with strong daily street visibility.
Where is this flex space located?
The property is located at 2025 E 4th St Lima, OH.
What is the asking price?
The asking price for this property is $2,850,000.
What are key features of this property?
This property features: 50,088 SF flex building at 2025 E 4th St, built in 1967; 23,000 SF of office/flex space scheduled for availability in June 2025; Remaining space leased to established tenants: Victress Health, S.S.O.E Inc., and Eagle Mark 4



