Corner-Lot Mixed-Use
For Sale
$389,000
Pending
202 N Quarry St, Dartmouth, MA 02747
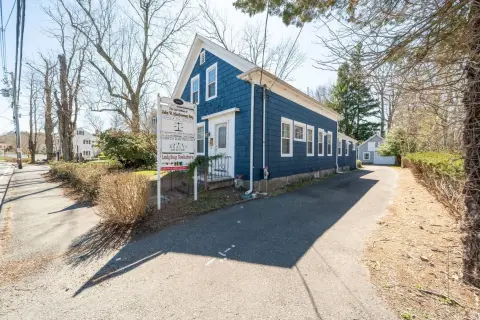
Four-bedroom layout with an equipped kitchen and first-floor living spaces.
Property Size1,940 SF
Days on Market49
Property Features for 202 N Quarry St
General Information
Standard status
Pending
Size
1,940 SF
Property subtype
Commercial
Additional Details
Highway Access
Yes
Building Details
Building Size
1,940 SF
Year Built
1940
Buildings
1
Listing Agency:
Pelletier Realty, Inc.
(508) 995-2676
Listed By:
Becky Demelo
(508) 726-4461
Source:
Iverty
Added: Sep 1
Changed: Oct 16
Last Checked: Oct 19 at 10:53AM
Displayed information is deemed reliable but is not guaranteed and should be independently verified. All listing content including descriptions, pricing, images are the copyrighted material of Pelletier Realty, Inc.

Ask AI about this property
Review the available facts, identify missing information and prepare questions for the agent.
Investment Insights
Based on property information with market context.
This mixed-use property is configured as a four-bedroom, two-bath residence with identified potential for residential and/or commercial use. The first floor contains a kitchen, dining area, living room, and den, with new flooring installed throughout those areas. The fully applianced kitchen also includes a washer and dryer, supporting a practical live-work arrangement.
Located at 202 N Quarry St in Dartmouth, the property occupies a corner lot spanning just over an acre. The surrounding area provides access to highways, UMass Dartmouth, and shopping. Built in 1940, the property combines established residential construction with a flexible use profile for an owner-occupant or work-from-home setup.
Located at 202 N Quarry St in Dartmouth, the property occupies a corner lot spanning just over an acre. The surrounding area provides access to highways, UMass Dartmouth, and shopping. Built in 1940, the property combines established residential construction with a flexible use profile for an owner-occupant or work-from-home setup.
Key Highlights
- Residential and/or commercial use is identified
- Four bedrooms and two bathrooms
- First floor includes a kitchen, dining area, living room, and den
Financial Insights
Estimated NOI and Cap Rate
NOI / Yr
$31,887
Cap Rate
8.20%
Suggested Prices Based on Cap Rates
Cap Rate 5%
$637,740
$637.7K
Cap Rate 7%
$455,529
$455.5K
Cap Rate 9%
$354,300
$354.3K
Market Conditions
NOI Build-Up for 1,940 SF
Gross rent
$53.1K $27.36/SF
− Vacancy
−$10.6K −$5.44/SF
EGI
$42.5K $21.92/SF
− OpEx
−$10.6K −$5.48/SF
NOI
$31.9K $16.44/SF
Area
Bristol County, MA
Vacancy
19.90%
Lease Rate
$27.36 /SF/Yr
Expense Ratio
25.00%
Simulate Cap Rate and NOI
Suggested Prices Based on Cap Rates
Cap Rate 5%
$637,740
Cap Rate 7%
$455,529
Cap Rate 9%
$354,300
Alternative Uses
Best Use
Office B
$455.5K
$398.6K – $531.5K
NOI $31,887 @ 7.0% cap · market cap 8.20%
Second Best
Mixed Use
$327.4K
$286.5K – $381.9K
NOI $22,916 @ 7.0% cap · market cap 5.89%
Theoretical Best
Office A
$1.18M
$1.03M – $1.38M
NOI $82,700 @ 7.0% cap · market cap 21.26%
Zoning and permitted uses should be independently verified with authorities.
How Realmo checks its estimates
Property Analytics
Current Use
Lease Details
Yes
Highway access
Location Intelligence
Trade Area within ½ mile
168
Businesses Nearby
Explore this area
Business Placement
Demographics for 02747, MA
22,326
Population
7,339
Households
3
Avg Household Size
40
Median Age
33%
College-Educated
85%
High-School Grad
41.0 sq mi
ZIP Area
545
Density / Sq Mi
$97,665
Median Household Income
$41,015
Median Earnings
$1,384
Median Rent
$460,400
Median Home Value
Market
Vacancy Rate% for Office in Northeast region




Frequently Asked Questions
What type of property is this?
Mixed-use property - Four-bedroom layout with an equipped kitchen and first-floor living spaces.
Where is this mixed-use property located?
The property is located at 202 N Quarry St Dartmouth, MA.
What is the asking price?
The asking price for this property is $389,000.
What are key features of this property?
This property features: Residential and/or commercial use is identified; Four bedrooms and two bathrooms; First floor includes a kitchen, dining area, living room, and den


