Equipped Bar and
For Sale
$250,000
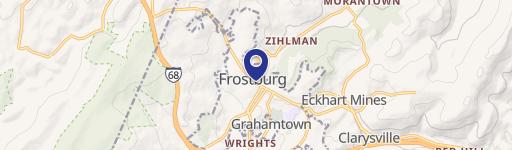
202 CENTER STREET, Frostburg, MD 21532
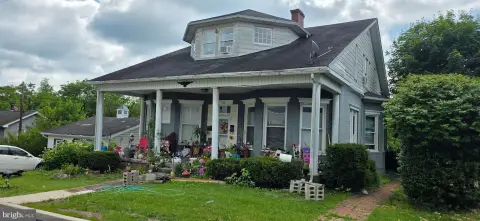
Operating bar with a liquor license, restaurant equipment, and commercial kitchen infrastructure in a university-oriented mixed-use district.
Property Size2,624 SF
Lot Size0.20 Acres
Price / SF$95.27
Days on Market50
Property Features for 202 CENTER STREET
General Information
Standard status
Active
Size
2,624 SF
Lot size
0.20 Acres
Property subtype
Commercial
Zoning
C1
Restaurant
Equipment Included
Yes
Liquor License
Yes
Additional Details
Furnished
Yes
Business Included
Yes
Building Details
Year Built
1920
Listing Agency:
Gates Realty
(240) 580-8494
Listed By:
Jared P Fradiska · License #663563
(301) 707-1097
Source:
Cummingsrealtors
Added: Sep 4
Changed: Oct 21
Last Checked: Oct 20 at 10:55PM
Displayed information is deemed reliable but is not guaranteed and should be independently verified. All listing content including descriptions, pricing, images are the copyrighted material of Gates Realty

Ask AI about this property
Review the available facts, identify missing information and prepare questions for the agent.
Investment Insights
Based on property information with market context.
This approximately 1,984-square-foot commercial property includes an operating bar along with restaurant and commercial kitchen areas that are currently unused. The sale includes the real estate, liquor license, bar and restaurant equipment, walk-ins, freezers, a large commercial refrigerator, furnishings, and fixtures. Existing staff is also in place. Built in 1920, the property occupies approximately 0.20 acres and is zoned C1 University Corridor/Mixed Use.
The property is located on Center Street in Frostburg within the University Corridor and serves a market that includes the local community and Frostburg State University. Previous operations included bar and restaurant service, private parties, special events, and student-night entertainment. The existing layout and equipment support continued bar operations, restaurant reactivation, or another permitted concept, subject to verification of zoning, licensing, equipment, and permitted uses.
The property is located on Center Street in Frostburg within the University Corridor and serves a market that includes the local community and Frostburg State University. Previous operations included bar and restaurant service, private parties, special events, and student-night entertainment. The existing layout and equipment support continued bar operations, restaurant reactivation, or another permitted concept, subject to verification of zoning, licensing, equipment, and permitted uses.
Key Highlights
- Approximately 1,984 square feet on approximately 0.20 acres
- Operating bar with included liquor license
- Restaurant and commercial kitchen areas currently unused
Property Analytics
Who owns this building?
See the owner, sales and loan history
Open Analytics
Current Use
Lease Details
Turnkey business
Opportunity
Yes
Liquor license
Location Intelligence
Trade Area within ½ mile
513
Businesses Nearby
Well-served
Demand for This Use
Explore this area
Business Placement
Demographics for 21532, MD
13,328
Population
6,044
Households
2.2
Avg Household Size
39
Median Age
33%
College-Educated
93%
High-School Grad
74.1 sq mi
ZIP Area
180
Density / Sq Mi
$60,158
Median Household Income
$33,054
Median Earnings
$839
Median Rent
$175,600
Median Home Value
Check the figures for this property
Cap Rate, Value Estimation, Potential NOI and more
View Realmo Analytics
Market
Vacancy Rate% for Retail in South region






Similar Off Market Nearby
- Starbucks — 101 Braddock Rd, Frostburg, MD 21532
- The Beach Club of Frostburg — 202 Center St, Frostburg, MD 21532
- The Main Street Pub — 163 E Main St, Frostburg, MD 21532
- the Main Streer Pub — 167 e main st, frostburg, md 21532
- The Deep End — 16 W Main St, Frostburg, MD 21532
Frequently Asked Questions
What type of property is this?
Bar & Pub - Operating bar with a liquor license, restaurant equipment, and commercial kitchen infrastructure in a university-oriented mixed-use district.
Where is this bar & pub located?
The property is located at 202 CENTER STREET Frostburg, MD.
What is the asking price?
The asking price for this property is $250,000.
What are key features of this property?
This property features: Approximately 1,984 square feet on approximately 0.20 acres; Operating bar with included liquor license; Restaurant and commercial kitchen areas currently unused


