Crossroads Arts District Mixed-Use
For Sale
Contact for pricing
2018 Main Street Kansas City, Kansas City, MO 64108
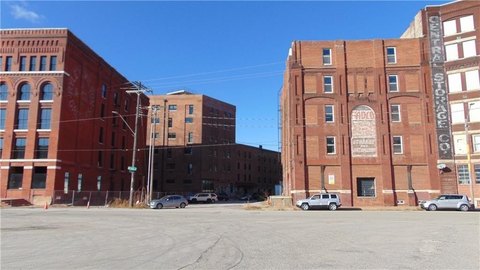
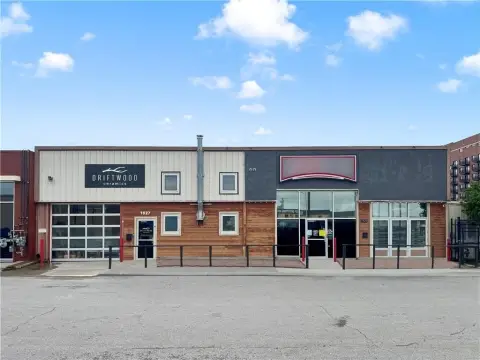
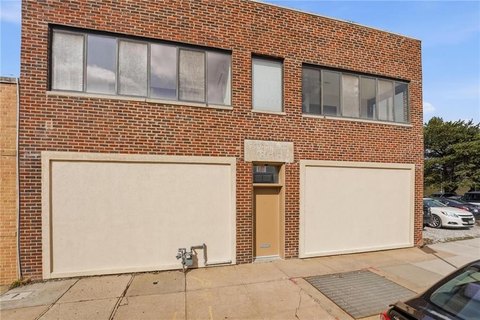
Mixed-use property in Kansas City's Crossroads Arts District.
Property Size18,600 SF
Price / SF$225.81
Days on Market224
Property Features for 2018 Main Street Kansas City
General Information
Standard status
Active
Size
18,600 SF
Class
B
Property subtype
Business for Sale, Hospitality, Mixed Use, Office, Retail
Investment Type
Value Add
Building Details
Units
4
Listing Agency:
Crossroads Real Estate Group
Listed By:
Sam Hagan · License #2019020815
(816) 298-9998
Source:
Crexi
Added: Mar 3
Changed: Oct 13
Last Checked: Oct 12 at 5:56PM
Displayed information is deemed reliable but is not guaranteed and should be independently verified. All listing content including descriptions, pricing, images are the copyrighted material of Crossroads Real Estate Group
Investment Insights
Based on property information with market context.
Located in the heart of Kansas City’s Crossroads Arts District, 2018 Main Street is a mixed-use property that was originally constructed in 1915 and has been thoughtfully renovated. The building has approximately 18,600 square feet of gross area and 12,414 square feet of net rentable area. The property benefits from its location directly on the KC Streetcar line, providing visibility, walkability, and connectivity to the Power & Light District, Union Station, Crown Center, and the T-Mobile Center. The asset features a diversified income profile with hospitality and office components. It also includes an elevator-served rooftop amenity deck with bar infrastructure and on-site garage parking.
Key Highlights
- Located directly on the KC Streetcar line in the Crossroads Arts District, offering exceptional visibility, walkability, and connectivity.
- Mixed‑use asset with diversified income profile from hospitality and office components.
- Elevator‑served rooftop amenity deck with bar infrastructure.
Financial Insights
Estimated NOI and Cap Rate
NOI / Yr
$204,647
Cap Rate
4.87%
Suggested Prices Based on Cap Rates
Cap Rate 5%
$4,092,940
$4.1M
Cap Rate 7%
$2,923,529
$2.9M
Cap Rate 9%
$2,273,856
$2.3M
Market Conditions
NOI Build-Up for 18,600 SF
Gross rent
$363.8K $19.56/SF
− Vacancy
−$36.4K −$1.96/SF
EGI
$327.4K $17.60/SF
− OpEx
−$122.8K −$6.60/SF
NOI
$204.6K $11.00/SF
Area
Kansas City, MO
Vacancy
10.00%
Lease Rate
$19.56 /SF/Yr
Expense Ratio
37.50%
Simulate Cap Rate and NOI
Suggested Prices Based on Cap Rates
Cap Rate 5%
$4,092,940
Cap Rate 7%
$2,923,529
Cap Rate 9%
$2,273,856
Alternative Uses
Best Use
Mixed Use
$2.92M
$2.56M – $3.41M
NOI $204,647 @ 7.0% cap · market cap 4.87%
Second Best
Hotel Hospitality
$1.67M
$1.46M – $1.94M
NOI $116,622 @ 7.0% cap · market cap 2.78%
Theoretical Best
Office A
$4.43M
$3.88M – $5.17M
NOI $310,123 @ 7.0% cap · market cap 7.38%
Zoning and permitted uses should be independently verified with authorities.
How Realmo checks its estimates
Property Analytics
Unlock full access to Insights
Subscribe to Realmo Intelligence
Open Analytics
Current Use
Location Intelligence
Trade Area within ½ mile
6,373
Businesses Nearby
Explore this area
Business Placement
Demographics for 64108, MO
9,839
Population
6,141
Households
1.6
Avg Household Size
35
Median Age
51%
College-Educated
90%
High-School Grad
3.7 sq mi
ZIP Area
2,659
Density / Sq Mi
$74,462
Median Household Income
$53,521
Median Earnings
$1,422
Median Rent
$286,300
Median Home Value
Check the figures for this property
Cap Rate, Value Estimation, Potential NOI and more
View Realmo Analytics

Questions? Ask Rey
Realmo’s AI knows this listing — price, zoning, demand, history. Ask anything.






Frequently Asked Questions
What type of property is this?
Mixed-use property - Mixed-use property in Kansas City's Crossroads Arts District.
Where is this mixed-use property located?
The property is located at 2018 Main Street Kansas City Kansas City, MO.
What is the asking price?
The asking price for this property is $4,200,000.
What are key features of this property?
This property features: Located directly on the KC Streetcar line in the Crossroads Arts District, offering exceptional visibility, walkability, and connectivity.; Mixed‑use asset with diversified income profile from hospitality and office components.; Elevator‑served rooftop amenity deck with bar infrastructure.