Renovated Three-Unit
For Sale
$875,000
Pending
2011 S ORANGE, Orlando, FL 32806
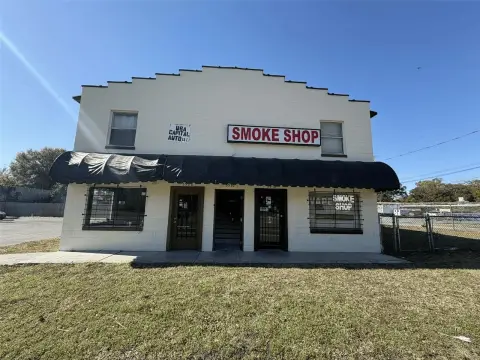
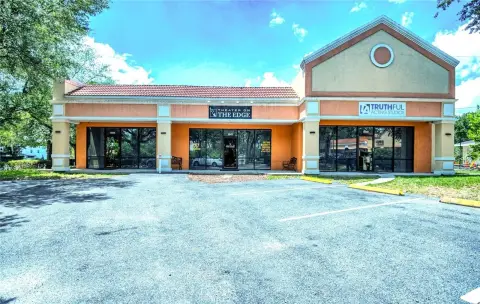
Three separate retail bays include updated building systems, refreshed restrooms, and a commercial kitchen in one unit.
Property Size3,057 SF
Days on Market57
Property Features for 2011 S ORANGE
General Information
Standard status
Pending
Size
3,057 SF
Total Parking Spaces
6
Property subtype
Commercial
Taxes and HOA fees
Annual Taxes
$11,302
Amenities
brand-new commercial kitchen
Building Details
Building Size
3,057 SF
Year Built
1954
Buildings
1
Tenancy
Multi
Listing Agency:
EXP REALTY LLC
Listed By:
Alistair Baxter · License #3423472
(786) 288-6316
Source:
Elliman
Added: Aug 13
Changed: Oct 3
Last Checked: Oct 7 at 12:57PM
Displayed information is deemed reliable but is not guaranteed and should be independently verified. All listing content including descriptions, pricing, images are the copyrighted material of EXP REALTY LLC
Investment Insights
Based on property information with market context.
The property at 2011 S Orange in Orlando is a three-unit storefront building totaling 3,057 SF under A/C. Completed improvements include a new roof, updated electrical service, and modernized restrooms serving each unit. One bay is equipped with a brand-new commercial kitchen, adding specialized infrastructure for food and beverage use.
Positioned directly across from Orlando Regional Medical Center, the building occupies an Orange Avenue corridor described as high traffic and high visibility. Each unit has 2 dedicated parking spaces, with additional street parking available. Walk Score is 80, Bike Score is 64, and Transit Score is 41.
Positioned directly across from Orlando Regional Medical Center, the building occupies an Orange Avenue corridor described as high traffic and high visibility. Each unit has 2 dedicated parking spaces, with additional street parking available. Walk Score is 80, Bike Score is 64, and Transit Score is 41.
Key Highlights
- 3,057 SF storefront building configured as 3 units
- Brand‑new commercial kitchen installed in one bay
- New roof and updated electrical system
Financial Insights
Estimated NOI and Cap Rate
NOI / Yr
$64,318
Cap Rate
7.35%
Suggested Prices Based on Cap Rates
Cap Rate 5%
$1,286,360
$1.3M
Cap Rate 7%
$918,829
$918.8K
Cap Rate 9%
$714,644
$714.6K
Market Conditions
NOI Build-Up for 3,057 SF
Gross rent
$88.8K $29.04/SF
− Vacancy
−$3.0K −$0.99/SF
EGI
$85.8K $28.05/SF
− OpEx
−$21.4K −$7.01/SF
NOI
$64.3K $21.04/SF
Area
Orlando, FL
Vacancy
3.40%
Lease Rate
$29.04 /SF/Yr
Expense Ratio
25.00%
Simulate Cap Rate and NOI
Suggested Prices Based on Cap Rates
Cap Rate 5%
$1,286,360
Cap Rate 7%
$918,829
Cap Rate 9%
$714,644
Alternative Uses
Best Use
Specialty Retail
$918.8K
$804.0K – $1.07M
NOI $64,318 @ 7.0% cap · market cap 7.35%
Second Best
Retail
$857.6K
$750.4K – $1.00M
NOI $60,030 @ 7.0% cap · market cap 6.86%
Theoretical Best
Office A
$984.8K
$861.7K – $1.15M
NOI $68,934 @ 7.0% cap · market cap 7.88%
Zoning and permitted uses should be independently verified with authorities.
Property Analytics
Current Use
Lease Details
Multi-tenant
Tenancy
Location Intelligence
Trade Area within ½ mile
90
Businesses Nearby
Under-served
Demand for This Use
Explore this area
Business Placement
Demographics for 32806, FL
26,582
Population
12,529
Households
2.1
Avg Household Size
40
Median Age
55%
College-Educated
95%
High-School Grad
6.8 sq mi
ZIP Area
3,909
Density / Sq Mi
$86,653
Median Household Income
$54,012
Median Earnings
$1,500
Median Rent
$415,800
Median Home Value
Market
Vacancy Rate% for Retail in Orlando, FL

Questions? Ask Rey
Realmo’s AI knows this listing — price, zoning, demand, history. Ask anything.





Frequently Asked Questions
What type of property is this?
Storefront property - Three separate retail bays include updated building systems, refreshed restrooms, and a commercial kitchen in one unit.
Where is this storefront property located?
The property is located at 2011 S ORANGE Orlando, FL.
What is the asking price?
The asking price for this property is $875,000.
What are key features of this property?
This property features: 3,057 SF storefront building configured as 3 units; Brand‑new commercial kitchen installed in one bay; New roof and updated electrical system


