Oceanfront Multifamily
For Sale
Contact for pricing
2010 S Ocean Blvd, Myrtle Beach, SC 29577
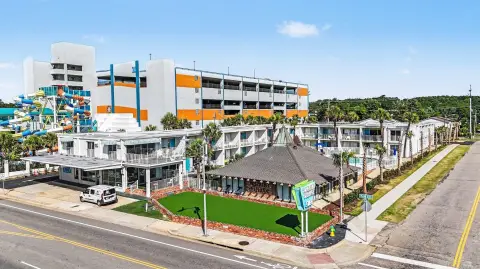
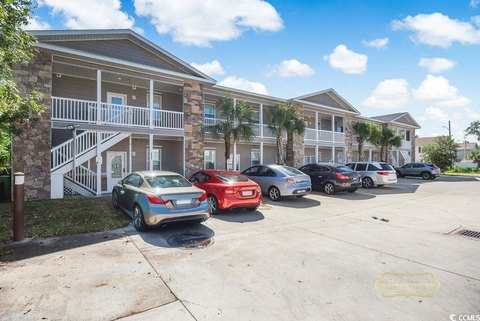
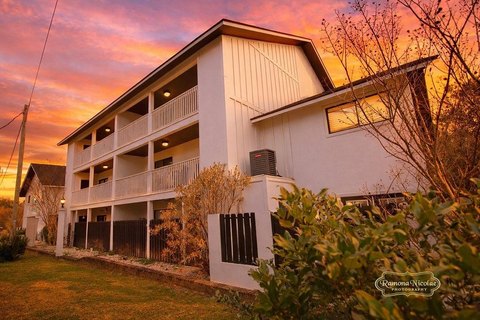
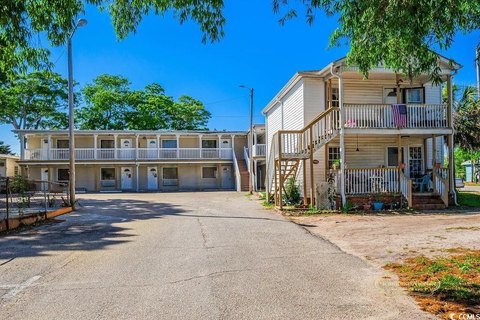
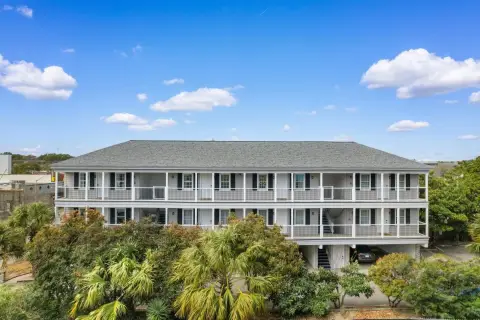
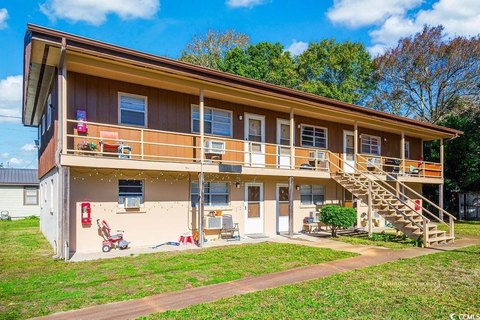
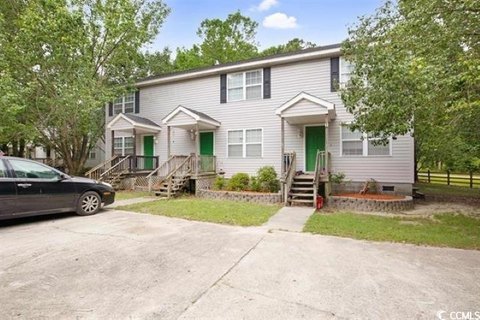
Fully renovated 65-unit multifamily property on Ocean Boulevard with one-bedroom and studio units.
Property Size28,190 SF
Lot Size0.70 Acres
Price / SF$239.45
Days on Market102
Property Features for 2010 S Ocean Blvd
General Information
Standard status
Active
Size
28,190 SF
Class
B
Lot size
0.70 Acres
Property subtype
Multifamily
Zoning
TA-120
Additional Details
Road Access
Yes
Sprinkler System
Yes
Multifamily Units
65
Building Details
Year Built
1968
Year Renovated
2024
Units
65
Tenancy
Multi
Listing Agency:
Realty ONE Group Dockside
Listed By:
Liat Edri · License #SC
(843) 444-4764
Source:
Crexi
Added: Jul 15
Changed: Oct 24
Last Checked: Oct 23 at 6:23AM
Displayed information is deemed reliable but is not guaranteed and should be independently verified. All listing content including descriptions, pricing, images are the copyrighted material of Realty ONE Group Dockside

Ask AI about this property
Review the available facts, identify missing information and prepare questions for the agent.
Investment Insights
Based on property information with market context.
This fully renovated 65-unit multifamily property is situated directly on Ocean Boulevard on a prominent corner lot. The building offers one-bedroom units and studio units, with comprehensive interior and systems upgrades completed in 2023–2024.
Improvements include new PEX plumbing throughout, a new sprinkler system and fire alarm installation, and servicing of all standpipes by AAA Fire Protection. Additional upgrades include drywall and interior painting, replacement of kitchen cabinets and countertops in most units, installation of new PTAC AC units, upgraded appliances throughout, and exterior painting and stucco. Mechanical work includes elevator repairs by Calvinder Elevator company and installation of a new 120-gallon boiler.
The offering also includes an additional parcel currently used as a parking lot, totaling approximately 0.70 acres, with a new parking lot developed on Cassandra Lane and landscaping completed per City of Myrtle Beach approved plans. Detailed financial documents, including profit & loss statements, capital expenditure reports, and rent rolls, are available to qualified buyers upon request.
Improvements include new PEX plumbing throughout, a new sprinkler system and fire alarm installation, and servicing of all standpipes by AAA Fire Protection. Additional upgrades include drywall and interior painting, replacement of kitchen cabinets and countertops in most units, installation of new PTAC AC units, upgraded appliances throughout, and exterior painting and stucco. Mechanical work includes elevator repairs by Calvinder Elevator company and installation of a new 120-gallon boiler.
The offering also includes an additional parcel currently used as a parking lot, totaling approximately 0.70 acres, with a new parking lot developed on Cassandra Lane and landscaping completed per City of Myrtle Beach approved plans. Detailed financial documents, including profit & loss statements, capital expenditure reports, and rent rolls, are available to qualified buyers upon request.
Key Highlights
- Fully renovated 65‑unit multifamily property on Ocean Blvd (corner lot) in Myrtle Beach, SC 29577, with one‑bedroom and studio units
- Renovations completed 2023–2024: new PEX water lines, sprinkler system and fire alarm, and servicing of all standpipes with AAA Fire Protection
- Mechanical and unit upgrades include new PTAC AC units in place, replacement of kitchen cabinets and countertops in most units, and upgraded appliances throughout
Financial Insights
Estimated NOI and Cap Rate
NOI / Yr
$260,230
Cap Rate
3.86%
Suggested Prices Based on Cap Rates
Cap Rate 5%
$5,204,600
$5.2M
Cap Rate 7%
$3,717,571
$3.7M
Cap Rate 9%
$2,891,444
$2.9M
Market Conditions
NOI Build-Up for 28,190 SF
Gross rent
$493.9K $17.52/SF
− Vacancy
−$20.7K −$0.74/SF
EGI
$473.1K $16.78/SF
− OpEx
−$212.9K −$7.55/SF
NOI
$260.2K $9.23/SF
Area
Horry County, SC
Vacancy
4.20%
Lease Rate
$17.52 /SF/Yr
Expense Ratio
45.00%
Simulate Cap Rate and NOI
Suggested Prices Based on Cap Rates
Cap Rate 5%
$5,204,600
Cap Rate 7%
$3,717,571
Cap Rate 9%
$2,891,444
Alternative Uses
Best Use
Apartment 5plus
$3.72M
$3.25M – $4.34M
NOI $260,230 @ 7.0% cap · market cap 3.86%
Second Best
—
—
no second resolved use
Theoretical Best
Office A
$7.14M
$6.25M – $8.34M
NOI $500,113 @ 7.0% cap · market cap 7.41%
Zoning and permitted uses should be independently verified with authorities.
How Realmo checks its estimates
Property Analytics
Unlock full access to Insights
Subscribe to Realmo Intelligence
Open Analytics
Lease Details
65
Residential units
Yes
Sprinkler system
Yes
Paved road access
Location Intelligence
Trade Area within ½ mile
486
Businesses Nearby
Explore this area
Business Placement
Demographics for 29577, SC
34,109
Population
22,630
Households
1.5
Avg Household Size
48
Median Age
30%
College-Educated
91%
High-School Grad
22.8 sq mi
ZIP Area
1,496
Density / Sq Mi
$48,561
Median Household Income
$33,591
Median Earnings
$1,130
Median Rent
$273,700
Median Home Value
Check the figures for this property
Cap Rate, Value Estimation, Potential NOI and more
View Realmo Analytics
Market
Vacancy Rate% for Multifamily in South region





Frequently Asked Questions
What type of property is this?
Apartment building - Fully renovated 65-unit multifamily property on Ocean Boulevard with one-bedroom and studio units.
Where is this apartment building located?
The property is located at 2010 S Ocean Blvd Myrtle Beach, SC.
What is the asking price?
The asking price for this property is $6,750,000.
What are key features of this property?
This property features: Fully renovated 65‑unit multifamily property on Ocean Blvd (corner lot) in Myrtle Beach, SC 29577, with one‑bedroom and studio units; Renovations completed 2023–2024: new PEX water lines, sprinkler system and fire alarm, and servicing of all standpipes with AAA Fire Protection; Mechanical and unit upgrades include new PTAC AC units in place, replacement of kitchen cabinets and countertops in most units, and upgraded appliances throughout


