Fully Equipped Office and Training
For Sale
Contact for pricing
200 Galbert Rd, Lafayette, LA 70506
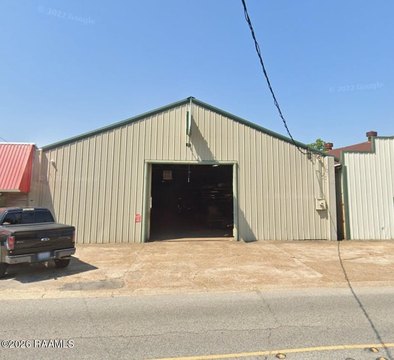
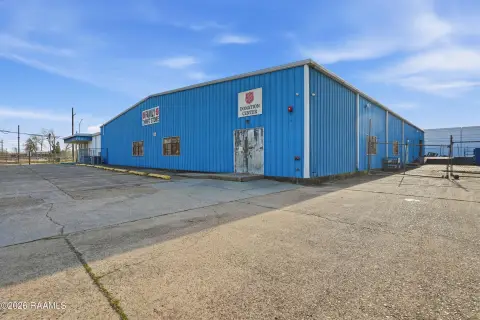
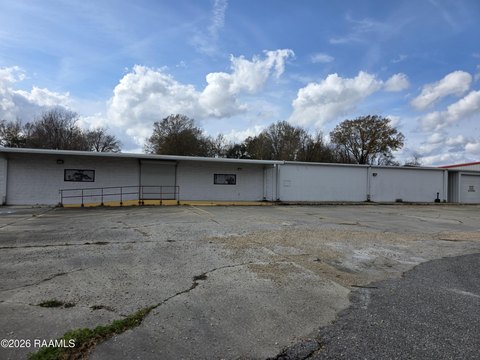
Two-building campus includes offices, training rooms, warehouse/shop space, and substantial parking for operational continuity.
Property Size45,326 SF
Lot Size4.71 Acres
Price / SF$0.00
Days on Market388
Property Features for 200 Galbert Rd
General Information
Standard status
Active
Size
45,326 SF
Total Parking Spaces
155
Lot size
4.71 Acres
Property subtype
Office
Zoning
IL
Lease Type
NNN
Additional Details
Highway Access
Yes
Amenities
Power
Water
Sewer
Vacant
155 Parking Spaces
Building Details
Year Built
1986
Tenancy
Single Tenant
Listing Agency:
NAI Rampart Commercial Real Estate Lafayette
Listed By:
John Monteleone CCIM · License #SALE.0000021351-ACT
(337) 278-6444
Source:
Lacdb.resimplifi
Added: Oct 1, 2025
Changed: Oct 12
Last Checked: Oct 23 at 3:22AM
Displayed information is deemed reliable but is not guaranteed and should be independently verified. All listing content including descriptions, pricing, images are the copyrighted material of NAI Rampart Commercial Real Estate Lafayette

Ask AI about this property
Review the available facts, identify missing information and prepare questions for the agent.
Investment Insights
Based on property information with market context.
200 Galbert Road is a two-building office and training campus offering a fully equipped work environment alongside warehouse/shop space. The office component features more than 40 private offices, six training rooms, and three conference rooms, each equipped with digital calendar management systems. Amenities include a recreation lounge, fitness center, medical stations, and a full commercial kitchen with dining hall. Dormitory accommodations support up to 68 occupants, and the site also includes warehouse/shop space to support a wider range of operational needs.
The property spans approximately 4.71 acres and is supported by professional landscaping and ample controlled-access parking, totaling 155 spaces including 10 oversized truck stalls. Industrial improvements include two 10-ton jib cranes and a 150-gallon, 220-amp air compressor. The facility is generator-ready with the ability to connect to a portable generator capable of powering the entire property. HVAC and building systems have been maintained and upgraded, including a 125-ton Trane HVAC system installed in 2012 with onsite DDC integration, and a hydraulic elevator upgraded in 2017 and remaining under warranty.
This setup is well suited for organizations seeking an on-site combination of office administration, structured training, and light industrial or service functions under one roof. The combination of significant parking, truck-oriented stalls, and warehouse/shop space can support day-to-day operations as well as staff and visitor needs for training and program delivery.
The property spans approximately 4.71 acres and is supported by professional landscaping and ample controlled-access parking, totaling 155 spaces including 10 oversized truck stalls. Industrial improvements include two 10-ton jib cranes and a 150-gallon, 220-amp air compressor. The facility is generator-ready with the ability to connect to a portable generator capable of powering the entire property. HVAC and building systems have been maintained and upgraded, including a 125-ton Trane HVAC system installed in 2012 with onsite DDC integration, and a hydraulic elevator upgraded in 2017 and remaining under warranty.
This setup is well suited for organizations seeking an on-site combination of office administration, structured training, and light industrial or service functions under one roof. The combination of significant parking, truck-oriented stalls, and warehouse/shop space can support day-to-day operations as well as staff and visitor needs for training and program delivery.
Key Highlights
- Two‑building office and training campus on approx. 4.71 acres with more than 40 private offices, six training rooms, and three conference rooms
- Full facility amenities include a recreation lounge, fitness center, medical stations, and a full commercial kitchen with dining hall
- Dormitory accommodations for up to 68 occupants plus controlled‑access parking for 155 vehicles, including 10 oversized truck stalls
Financial Insights
Estimated NOI and Cap Rate
NOI / Yr
$198,578
Suggested Prices Based on Cap Rates
Cap Rate 5%
$3,971,560
$4.0M
Cap Rate 7%
$2,836,829
$2.8M
Cap Rate 9%
$2,206,422
$2.2M
Market Conditions
NOI Build-Up for 45,326 SF
Gross rent
$320.9K $7.08/SF
− Vacancy
−$15.4K −$0.34/SF
EGI
$305.5K $6.74/SF
− OpEx
−$106.9K −$2.36/SF
NOI
$198.6K $4.38/SF
Area
Lafayette, LA
Vacancy
4.80%
Lease Rate
$7.08 /SF/Yr
Expense Ratio
35.00%
Simulate Cap Rate and NOI
Suggested Prices Based on Cap Rates
Cap Rate 5%
$3,971,560
Cap Rate 7%
$2,836,829
Cap Rate 9%
$2,206,422
Alternative Uses
Best Use
Warehouse
$3.71M
$3.25M – $4.33M
NOI $259,679 @ 7.0% cap · market cap 3,922,643.50%
Second Best
Industrial
$3.06M
$2.67M – $3.56M
NOI $213,853 @ 7.0% cap · market cap 3,230,407.85%
Theoretical Best
Office A
$10.72M
$9.38M – $12.50M
NOI $750,163 @ 7.0% cap · market cap 11,331,767.37%
Zoning and permitted uses should be independently verified with authorities.
How Realmo checks its estimates
Property Analytics
Unlock full access to Insights
Subscribe to Realmo Intelligence
Open Analytics
Current Use
Lease Details
Yes
Highway access
Location Intelligence
Trade Area within ½ mile
283
Businesses Nearby
Balanced
Demand for This Use
Explore this area
Business Placement
Demographics for 70506, LA
39,801
Population
20,296
Households
2
Avg Household Size
36
Median Age
37%
College-Educated
91%
High-School Grad
20.8 sq mi
ZIP Area
1,914
Density / Sq Mi
$55,553
Median Household Income
$38,764
Median Earnings
$1,024
Median Rent
$215,700
Median Home Value
Check the figures for this property
Cap Rate, Value Estimation, Potential NOI and more
View Realmo Analytics
Market
Vacancy Rate% for Industrial in South region






Frequently Asked Questions
What type of property is this?
Flex space - Two-building campus includes offices, training rooms, warehouse/shop space, and substantial parking for operational continuity.
Where is this flex space located?
The property is located at 200 Galbert Rd Lafayette, LA.
What are key features of this property?
This property features: Two‑building office and training campus on approx. 4.71 acres with more than 40 private offices, six training rooms, and three conference rooms; Full facility amenities include a recreation lounge, fitness center, medical stations, and a full commercial kitchen with dining hall; Dormitory accommodations for up to 68 occupants plus controlled‑access parking for 155 vehicles, including 10 oversized truck stalls


