Renovated Lower-Level Retail
For Sale
$439,000
20 Shore Rd Unit 8, Ogunquit, ME 03907
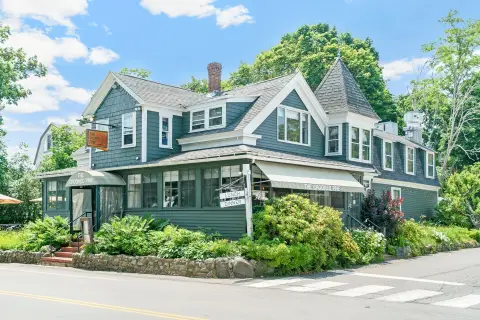
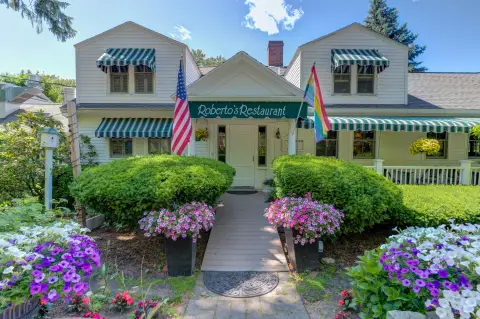
Commercial condominium with Shore Road visibility, dual access points, and classic interior finishes.
Property Size1,796 SF
Price / SF$244.43
Days on Market67
Property Features for 20 Shore Rd Unit 8
General Information
Standard status
Active
Size
1,796 SF
Additional Details
Floor
Lower Level
Building Details
Year Built
1961
Year Renovated
2022
Listing Agency:
Anne Erwin Sotheby's International Realty
Listed By:
Anne Erwin Real Estate
(207) 363-6640
Source:
Samonasgroup
Added: Aug 10
Changed: Oct 8
Last Checked: Oct 7 at 2:38PM
Displayed information is deemed reliable but is not guaranteed and should be independently verified. All listing content including descriptions, pricing, images are the copyrighted material of Anne Erwin Sotheby's International Realty
Investment Insights
Based on property information with market context.
This 1,796-square-foot lower-level commercial condominium in Ogunquit Village combines a 2022 renovation with character elements including a fireplace, rich millwork, and classic finishes. The property was built in 1961 and has been updated for contemporary commercial use.
Positioned along Shore Road, the space benefits from visibility and two access points. Its Ogunquit setting places it among local shops and restaurants, with activity described as year-round. The configuration has been presented for retail, gallery, wellness, office, café, and coworking applications.
Positioned along Shore Road, the space benefits from visibility and two access points. Its Ogunquit setting places it among local shops and restaurants, with activity described as year-round. The configuration has been presented for retail, gallery, wellness, office, café, and coworking applications.
Key Highlights
- 1,796 SF lower‑level commercial condominium
- Renovated in 2022; building constructed in 1961
- Located along Shore Road in Ogunquit Village
Financial Insights
Estimated NOI and Cap Rate
NOI / Yr
$29,418
Cap Rate
6.70%
Suggested Prices Based on Cap Rates
Cap Rate 5%
$588,360
$588.4K
Cap Rate 7%
$420,257
$420.3K
Cap Rate 9%
$326,867
$326.9K
Market Conditions
NOI Build-Up for 1,796 SF
Gross rent
$44.8K $24.96/SF
− Vacancy
−$5.6K −$3.12/SF
EGI
$39.2K $21.84/SF
− OpEx
−$9.8K −$5.46/SF
NOI
$29.4K $16.38/SF
Area
York County, ME
Vacancy
12.50%
Lease Rate
$24.96 /SF/Yr
Expense Ratio
25.00%
Simulate Cap Rate and NOI
Suggested Prices Based on Cap Rates
Cap Rate 5%
$588,360
Cap Rate 7%
$420,257
Cap Rate 9%
$326,867
Alternative Uses
Best Use
Office B
$420.3K
$367.7K – $490.3K
NOI $29,418 @ 7.0% cap · market cap 6.70%
Second Best
Retail
$311.6K
$272.6K – $363.5K
NOI $21,810 @ 7.0% cap · market cap 4.97%
Theoretical Best
Office A
$569.3K
$498.2K – $664.2K
NOI $39,853 @ 7.0% cap · market cap 9.08%
Zoning and permitted uses should be independently verified with authorities.
How Realmo checks its estimates
Property Analytics
Unlock full access to Insights
Subscribe to Realmo Intelligence
Open Analytics
Current Use
Location Intelligence
Trade Area within ½ mile
328
Businesses Nearby
Explore this area
Business Placement
Demographics for 03907, ME
1,577
Population
2,106
Households
0.7
Avg Household Size
62
Median Age
68%
College-Educated
99%
High-School Grad
4.1 sq mi
ZIP Area
385
Density / Sq Mi
$104,250
Median Household Income
$72,778
Median Earnings
$1,736
Median Rent
$799,200
Median Home Value
Check the figures for this property
Cap Rate, Value Estimation, Potential NOI and more
View Realmo Analytics
Market
Vacancy Rate% for Office in Northeast region

Questions? Ask Rey
Realmo’s AI knows this listing — price, zoning, demand, history. Ask anything.


Frequently Asked Questions
What type of property is this?
Retail space - Commercial condominium with Shore Road visibility, dual access points, and classic interior finishes.
Where is this retail space located?
The property is located at 20 Shore Rd Unit 8 Ogunquit, ME.
What is the asking price?
The asking price for this property is $439,000.
What are key features of this property?
This property features: 1,796 SF lower‑level commercial condominium; Renovated in 2022; building constructed in 1961; Located along Shore Road in Ogunquit Village


