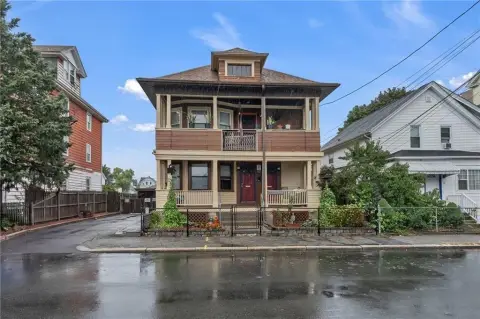
Pawtucket Triplex Investment
For Sale
$660,000
20 Barnes Street, Pawtucket, RI 02860
Three-family property with nine bedrooms, updated units, and income potential.
Property Size2,766 SF
Lot Size0.07 Acres
Days on Market398
Property Features for 20 Barnes Street
General Information
Standard status
Active
Size
2,766 SF
Lot size
0.07 Acres
Property subtype
Multi-Family
Amenities
Baseboard
Gas
Window Unit(s)
Gas Water Heater
Oven
Range
Refrigerator
Porch
Building Details
Building Size
2,766 SF
Year Built
1920
Listing Agency:
HomeSmart Professionals
Listed By:
Yawa Amefia
(401) 921-5011
Source:
Kw
Added: Sep 11, 2025
Changed: Oct 13
Last Checked: Oct 12 at 6:30PM
Displayed information is deemed reliable but is not guaranteed and should be independently verified. All listing content including descriptions, pricing, images are the copyrighted material of HomeSmart Professionals
Investment Insights
Based on property information with market context.
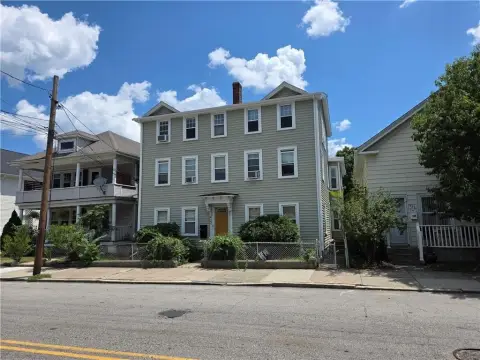
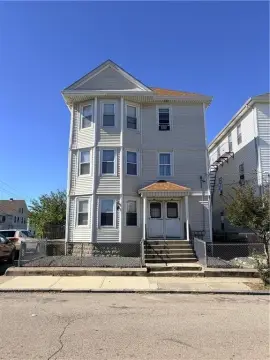
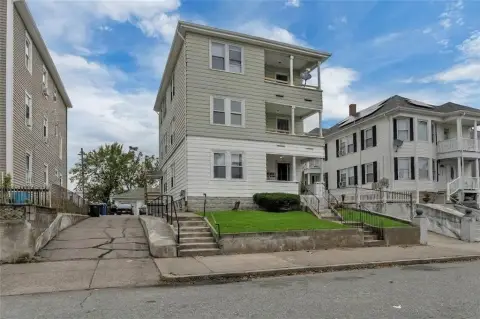
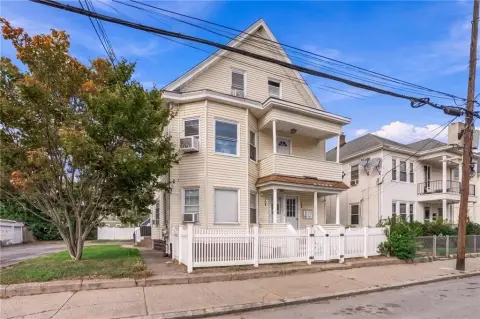
Located in the Woodlawn neighborhood of Pawtucket, this three-family property presents an investment opportunity. The property features a total of nine bedrooms and four full baths. A one-car garage is included. Unit 1 has been completely renovated and is ready for immediate occupancy at market rent. Unit 2 is occupied by a long-term tenant, while Unit 3 was updated just two years ago. The finished basement includes two additional rooms and a full bathroom, offering flexible use as storage or bonus living space, adding extra income potential. The property's current rents produce solid cash flow with the ability to exceed $6,500 per month once stabilized. The property is located near shopping, schools, highway access, the brand-new Pawtucket/Central Falls commuter rail station, and the state-of-the-art professional soccer stadium.
Key Highlights
- Solid cash flow with potential to exceed $6,500 per month.
- Three‑family property with nine bedrooms and four full baths.
- Unit 1 completely renovated and ready for immediate occupancy at market rent.**
Financial Insights
Estimated NOI and Cap Rate
NOI / Yr
$46,055
Cap Rate
6.98%
Suggested Prices Based on Cap Rates
Cap Rate 5%
$921,100
$921.1K
Cap Rate 7%
$657,929
$657.9K
Cap Rate 9%
$511,722
$511.7K
Market Conditions
NOI Build-Up for 2,766 SF
Gross rent
$70.4K $25.44/SF
− Vacancy
−$4.6K −$1.65/SF
EGI
$65.8K $23.79/SF
− OpEx
−$19.7K −$7.14/SF
NOI
$46.1K $16.65/SF
Area
Providence County, RI
Vacancy
6.50%
Lease Rate
$25.44 /SF/Yr
Expense Ratio
30.00%
Simulate Cap Rate and NOI
Suggested Prices Based on Cap Rates
Cap Rate 5%
$921,100
Cap Rate 7%
$657,929
Cap Rate 9%
$511,722
Alternative Uses
Best Use
Multifamily LT 5
$657.9K
$575.7K – $767.6K
NOI $46,055 @ 7.0% cap · market cap 6.98%
Second Best
Apartment 5plus
$522.2K
$456.9K – $609.2K
NOI $36,551 @ 7.0% cap · market cap 5.54%
Theoretical Best
—
—
same as Best Use
Zoning and permitted uses should be independently verified with authorities.
How Realmo checks its estimates
Property Analytics
Unlock full access to Insights
Subscribe to Realmo Intelligence
Open Analytics
Current Use
Location Intelligence
Trade Area within ½ mile
1,048
Businesses Nearby
Explore this area
Business Placement
Demographics for 02860, RI
47,894
Population
21,467
Households
2.2
Avg Household Size
37
Median Age
25%
College-Educated
80%
High-School Grad
5.3 sq mi
ZIP Area
9,037
Density / Sq Mi
$59,954
Median Household Income
$42,038
Median Earnings
$1,112
Median Rent
$287,400
Median Home Value
Check the figures for this property
Cap Rate, Value Estimation, Potential NOI and more
View Realmo Analytics
Market
Vacancy Rate% for Multifamily in Northeast region

Questions? Ask Rey
Realmo’s AI knows this listing — price, zoning, demand, history. Ask anything.







Frequently Asked Questions
What type of property is this?
Triplex - Three-family property with nine bedrooms, updated units, and income potential.
Where is this triplex located?
The property is located at 20 Barnes Street Pawtucket, RI.
What is the asking price?
The asking price for this property is $660,000.
What are key features of this property?
This property features: Solid cash flow with potential to exceed $6,500 per month.; Three‑family property with nine bedrooms and four full baths.; Unit 1 completely renovated and ready for immediate occupancy at market rent.**


