Renovated Triplex
For Sale
$2,300,000
Pending
20-22 Rockville Park, Boston, MA 02119
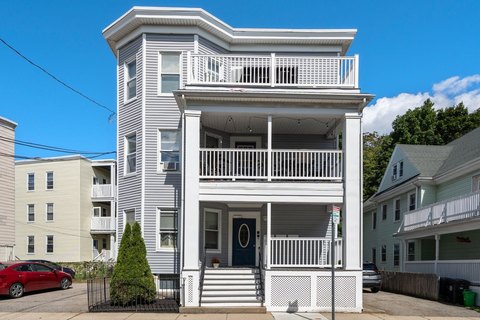
Two semi-detached residential buildings provide modern kitchens, upgraded systems, separate deeds, and parking for multiple households.
Property Size4,296 SF
Days on Market55
Property Features for 20-22 Rockville Park
General Information
Standard status
Pending
Size
4,296 SF
Total Parking Spaces
10
Property subtype
5+ Family - 5+ Units Side by Side
Additional Details
Multifamily Units
6
Building Details
Building Size
4,296 SF
Year Built
1910
Year Renovated
2025
Buildings
2
Listing Agency:
REMAX Andrew Realty Services
(781) 395-7676
Listed By:
Guy Contaldi
(617) 201-0247
Source:
Iverty
Added: Aug 13
Changed: Oct 6
Last Checked: Oct 5 at 6:47PM
Displayed information is deemed reliable but is not guaranteed and should be independently verified. All listing content including descriptions, pricing, images are the copyrighted material of REMAX Andrew Realty Services
Investment Insights
Based on property information with market context.
This offering comprises two semi-detached residential buildings on separate deeds, with three units in each building for a combined six-unit configuration. Both properties underwent gut renovations in 2021 and 2025, including updated plumbing and electrical systems, modern kitchens with stainless appliances, and recessed lighting. Four of the six units are de-leaded, and the property includes 10 parking spaces. Each building is eligible for residential financing.
The property is located at 20-22 Rockville Park in Boston’s Roxbury area, on a dead-end street near Northeastern University, the Longwood Medical Area, and the South End. Walk Score is 77, Bike Score is 78, and Transit Score is 92, indicating strong access to walking, bicycling, and public transportation. The buildings were originally constructed in 1910.
The property is located at 20-22 Rockville Park in Boston’s Roxbury area, on a dead-end street near Northeastern University, the Longwood Medical Area, and the South End. Walk Score is 77, Bike Score is 78, and Transit Score is 92, indicating strong access to walking, bicycling, and public transportation. The buildings were originally constructed in 1910.
Key Highlights
- Combined six‑unit configuration across two separate‑deed buildings
- Gut renovations completed in 2021 and 2025
- Modern kitchens with stainless appliances and recessed lighting
Financial Insights
Estimated NOI and Cap Rate
NOI / Yr
$108,557
Cap Rate
4.72%
Suggested Prices Based on Cap Rates
Cap Rate 5%
$2,171,140
$2.2M
Cap Rate 7%
$1,550,814
$1.6M
Cap Rate 9%
$1,206,189
$1.2M
Market Conditions
NOI Build-Up for 4,296 SF
Gross rent
$162.4K $37.80/SF
− Vacancy
−$7.3K −$1.70/SF
EGI
$155.1K $36.10/SF
− OpEx
−$46.5K −$10.83/SF
NOI
$108.6K $25.27/SF
Area
Boston, MA
Vacancy
4.50%
Lease Rate
$37.80 /SF/Yr
Expense Ratio
30.00%
Simulate Cap Rate and NOI
Suggested Prices Based on Cap Rates
Cap Rate 5%
$2,171,140
Cap Rate 7%
$1,550,814
Cap Rate 9%
$1,206,189
Alternative Uses
Best Use
Multifamily LT 5
$1.55M
$1.36M – $1.81M
NOI $108,557 @ 7.0% cap · market cap 4.72%
Second Best
Apartment 5plus
$1.44M
$1.26M – $1.68M
NOI $100,922 @ 7.0% cap · market cap 4.39%
Theoretical Best
Office A
$3.22M
$2.81M – $3.75M
NOI $225,179 @ 7.0% cap · market cap 9.79%
Zoning and permitted uses should be independently verified with authorities.
Property Analytics
Unlock full access to Insights
Subscribe to Realmo Intelligence
Open Analytics
Current Use
Lease Details
6
Residential units
Location Intelligence
Trade Area within ½ mile
1,897
Businesses Nearby
Explore this area
Business Placement
Demographics for 02119, MA
29,175
Population
12,937
Households
2.3
Avg Household Size
34
Median Age
30%
College-Educated
81%
High-School Grad
1.6 sq mi
ZIP Area
18,234
Density / Sq Mi
$43,255
Median Household Income
$38,664
Median Earnings
$1,252
Median Rent
$668,900
Median Home Value
Check the figures for this property
Cap Rate, Value Estimation, Potential NOI and more
View Realmo Analytics
Market
Vacancy Rate% for Multifamily in Northeast region

Questions? Ask Rey
Realmo’s AI knows this listing — price, zoning, demand, history. Ask anything.



Frequently Asked Questions
What type of property is this?
Triplex - Two semi-detached residential buildings provide modern kitchens, upgraded systems, separate deeds, and parking for multiple households.
Where is this triplex located?
The property is located at 20-22 Rockville Park Boston, MA.
What is the asking price?
The asking price for this property is $2,300,000.
What are key features of this property?
This property features: Combined six‑unit configuration across two separate‑deed buildings; Gut renovations completed in 2021 and 2025; Modern kitchens with stainless appliances and recessed lighting