Updated Duplex with Pool and
For Sale
$795,000
2-221 Avenida Ortega, Palm Springs, CA 92264
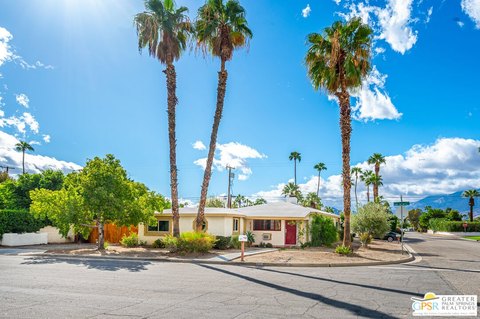
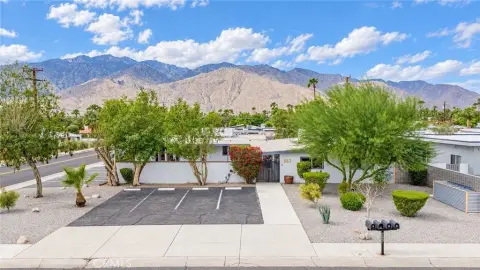
Two detached residences feature refreshed interiors, private parking, and access to an in-ground pool and spa.
Property Size1,624 SF
Lot Size0.17 Acres
Price / SF$489.53
Days on Market50
Property Features for 2-221 Avenida Ortega
General Information
Standard status
Active
Size
1,624 SF
Total Parking Spaces
3
Lot size
0.17 Acres
Property subtype
Residential Income
Zoning
R-3
Property Condition
Severity
Repairs Needed
Evidence
desert landscaping is the primary area requiring buyer attention/TLC
Units
Unit Mix
1 x 2BR/1BA, 1 x 2BR/1.5BA
Multifamily Units
2
Amenities
pool
spa
fenced lot
private gates
Building Details
Buildings
2
Listing Agency:
WINNIE CHEN, BROKER
Listed By:
Winnie Chen
(626) 485-2510
Source:
Exprealty
Added: Aug 28
Changed: Oct 2
Last Checked: Oct 15 at 2:46AM
Displayed information is deemed reliable but is not guaranteed and should be independently verified. All listing content including descriptions, pricing, images are the copyrighted material of WINNIE CHEN, BROKER

Ask AI about this property
Review the available facts, identify missing information and prepare questions for the agent.
Investment Insights
Based on property information with market context.
This duplex property includes two detached residences totaling 1,624 square feet on a 7,405-square-foot lot. The front home offers 2 bedrooms and 1 bathroom in approximately 824 square feet, while the rear home provides 2 bedrooms and 1.5 bathrooms across approximately 800 square feet. Both interiors have been updated, and the property includes an in-ground pool and spa with equipment less than 1 year old.
Located in Tahquitz River Estates in South Palm Springs, the property has views of the San Jacinto Mountain range. High-density R-3 zoning, fee-simple land ownership, and no HOA apply. The fully fenced parcel includes cinderblock walls, private gates, and off-street driveway parking for up to 3 vehicles. The structures, interiors, and pool are complete; desert landscaping requires additional attention.
Located in Tahquitz River Estates in South Palm Springs, the property has views of the San Jacinto Mountain range. High-density R-3 zoning, fee-simple land ownership, and no HOA apply. The fully fenced parcel includes cinderblock walls, private gates, and off-street driveway parking for up to 3 vehicles. The structures, interiors, and pool are complete; desert landscaping requires additional attention.
Key Highlights
- Two detached residences totaling 1,624 sq. ft.
- Front residence: 2 bedrooms, 1 bathroom, approximately 824 sq. ft.
- Rear residence: 2 bedrooms, 1.5 bathrooms, approximately 800 sq. ft.
Financial Insights
Estimated NOI and Cap Rate
NOI / Yr
$28,534
Cap Rate
3.59%
Suggested Prices Based on Cap Rates
Cap Rate 5%
$570,680
$570.7K
Cap Rate 7%
$407,629
$407.6K
Cap Rate 9%
$317,044
$317.0K
Market Conditions
NOI Build-Up for 1,624 SF
Gross rent
$41.5K $25.56/SF
− Vacancy
−$747 −$0.46/SF
EGI
$40.8K $25.10/SF
− OpEx
−$12.2K −$7.53/SF
NOI
$28.5K $17.57/SF
Area
Riverside County, CA
Vacancy
1.80%
Lease Rate
$25.56 /SF/Yr
Expense Ratio
30.00%
Simulate Cap Rate and NOI
Suggested Prices Based on Cap Rates
Cap Rate 5%
$570,680
Cap Rate 7%
$407,629
Cap Rate 9%
$317,044
Alternative Uses
Best Use
Multifamily LT 5
$407.6K
$356.7K – $475.6K
NOI $28,534 @ 7.0% cap · market cap 3.59%
Second Best
Apartment 5plus
$375.5K
$328.6K – $438.1K
NOI $26,287 @ 7.0% cap · market cap 3.31%
Theoretical Best
Office A
$486.5K
$425.7K – $567.6K
NOI $34,057 @ 7.0% cap · market cap 4.28%
Zoning and permitted uses should be independently verified with authorities.
How Realmo checks its estimates
Property Analytics
Current Use
Lease Details
2
Residential units
Location Intelligence
Trade Area within ½ mile
414
Businesses Nearby
Explore this area
Business Placement
Demographics for 92264, CA
19,254
Population
17,518
Households
1.1
Avg Household Size
61
Median Age
48%
College-Educated
94%
High-School Grad
50.9 sq mi
ZIP Area
378
Density / Sq Mi
$75,246
Median Household Income
$46,756
Median Earnings
$1,581
Median Rent
$498,200
Median Home Value
Market
Vacancy Rate% for Multifamily in West region





Frequently Asked Questions
What type of property is this?
Duplex - Two detached residences feature refreshed interiors, private parking, and access to an in-ground pool and spa.
Where is this duplex located?
The property is located at 2-221 Avenida Ortega Palm Springs, CA.
What is the asking price?
The asking price for this property is $795,000.
What are key features of this property?
This property features: Two detached residences totaling 1,624 sq. ft.; Front residence: 2 bedrooms, 1 bathroom, approximately 824 sq. ft.; Rear residence: 2 bedrooms, 1.5 bathrooms, approximately 800 sq. ft.


