19-Unit Apartment
For Sale
$2,000,000
1964 NW Johnson St, Portland, OR 97209
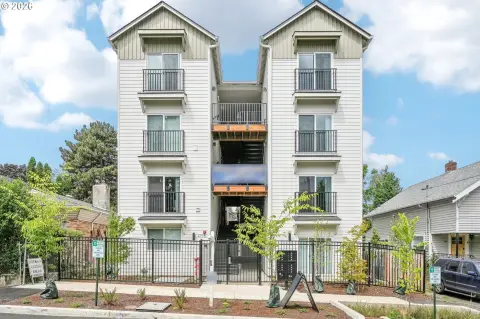
Historic urban property with a diverse studio and one- and two-bedroom unit mix near Portland’s NW 23rd and NW 21st corridors.
Property Size9,655 SF
Days on Market55
Property Features for 1964 NW Johnson St
General Information
Standard status
Active
Size
9,655 SF
Property subtype
Multifamily
Occupancy
95%
Units
Unit Mix
16 x studio, 2 x one-bedroom, 1 x two-bedroom
Multifamily Units
19
Additional Details
Public Transit
Yes
Amenities
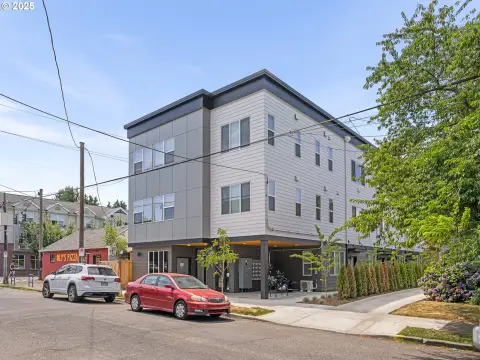
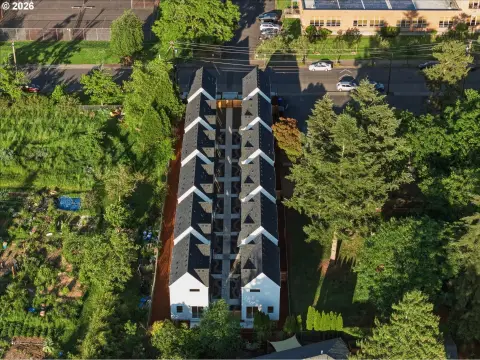
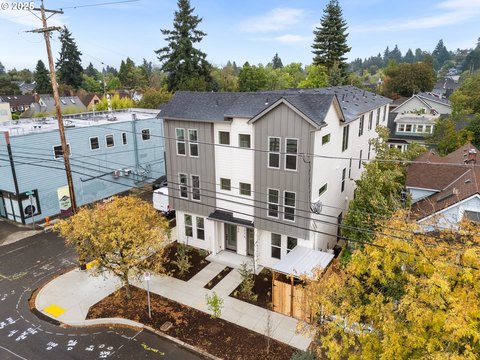
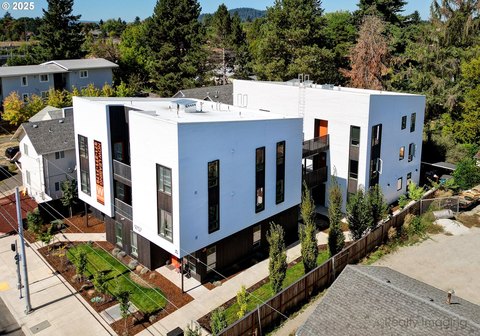
CLASSIC ALPHABET DISTRICT ASSET - 1927 Vintage Apartment Building Consisting of 19 Units, Including 16 Studios, 2 One-Bedrooms, and 1 Two-Bedroom Unit
PRIME NW PORTLAND LOCATION - Situated in the Highly Desirable and Walkable Alphabet District, Providing Tenants with Convenient Access to NW 23rd and 21st Avenue Retail, Dining, Parks, and Employment
CHARMING VINTAGE ARCHITECTURE - Strong Curb Appeal, Period Details, and Classic Layouts Drive Tenant Demand and Long-Term Retention
VALUE-ADD POTENTIAL - Rents Approximately 12% Below Market with Room for Further Strategic Upgrades, Providing a Clear Path to Increasing Cash Flow
MARKET MOMENTUM - Portland Recorded a 15% Year-Over-Year Increase in Deal Activity, Signaling Renewed Investor Confidence and a Strengthening Investment Environment
Building Details
Building Size
9,655 SF
Year Built
1927
Units
19
Listed By:
Matthew Bruegge · License #License(s): OR: 201260802
(503) 200-2088
Source:
Marcusmillichap
Added: Aug 13
Changed: Sep 2
Last Checked: Oct 5 at 3:01PM
Displayed information is deemed reliable but is not guaranteed and should be independently verified. All listing content including descriptions, pricing, images are the copyrighted material of Matthew Bruegge
Investment Insights
Based on property information with market context.
Built in 1927, this 19-unit apartment property at 1964 NW Johnson St includes 16 studios, two one-bedroom units, and one two-bedroom unit. The building retains period architectural details and an established street presence, with a unit mix concentrated in studios and smaller apartments.
The property is positioned near Portland’s NW 23rd and NW 21st Avenue corridors, which include retail, restaurants, coffee shops, fitness studios, and everyday services. Forest Park and the Portland Streetcar line are also nearby. Current rents are approximately 12% below market, and the property’s reported 6.10% cap rate provides additional operating context for prospective investors.
The property is positioned near Portland’s NW 23rd and NW 21st Avenue corridors, which include retail, restaurants, coffee shops, fitness studios, and everyday services. Forest Park and the Portland Streetcar line are also nearby. Current rents are approximately 12% below market, and the property’s reported 6.10% cap rate provides additional operating context for prospective investors.
Key Highlights
- 19‑unit apartment building constructed in 1927
- Unit mix includes 16 studios, 2 one‑bedrooms, and 1 two‑bedroom unit
- Located at 1964 NW Johnson St in Portland, OR 97209
Financial Insights
Estimated NOI and Cap Rate
NOI / Yr
$123,970
Cap Rate
6.20%
Suggested Prices Based on Cap Rates
Cap Rate 5%
$2,479,400
$2.5M
Cap Rate 7%
$1,771,000
$1.8M
Cap Rate 9%
$1,377,444
$1.4M
Market Conditions
NOI Build-Up for 9,655 SF
Gross rent
$237.5K $24.60/SF
− Vacancy
−$12.1K −$1.25/SF
EGI
$225.4K $23.35/SF
− OpEx
−$101.4K −$10.51/SF
NOI
$124.0K $12.84/SF
Area
Portland, OR
Vacancy
5.10%
Lease Rate
$24.60 /SF/Yr
Expense Ratio
45.00%
Simulate Cap Rate and NOI
Suggested Prices Based on Cap Rates
Cap Rate 5%
$2,479,400
Cap Rate 7%
$1,771,000
Cap Rate 9%
$1,377,444
Alternative Uses
Best Use
Apartment 5plus
$1.77M
$1.55M – $2.07M
NOI $123,970 @ 7.0% cap · market cap 6.20%
Second Best
—
—
no second resolved use
Theoretical Best
Office A
$2.71M
$2.37M – $3.16M
NOI $189,795 @ 7.0% cap · market cap 9.49%
Zoning and permitted uses should be independently verified with authorities.
Property Analytics
Unlock full access to Insights
Subscribe to Realmo Intelligence
Open Analytics
Current Use
Lease Details
19
Residential units
Location Intelligence
Trade Area within ½ mile
9,750
Businesses Nearby
Explore this area
Business Placement
Demographics for 97209, OR
22,755
Population
16,437
Households
1.4
Avg Household Size
38
Median Age
66%
College-Educated
96%
High-School Grad
1.0 sq mi
ZIP Area
22,755
Density / Sq Mi
$84,059
Median Household Income
$68,731
Median Earnings
$1,669
Median Rent
$573,700
Median Home Value
Check the figures for this property
Cap Rate, Value Estimation, Potential NOI and more
View Realmo Analytics
Market
Vacancy Rate% for Multifamily in West region

Questions? Ask Rey
Realmo’s AI knows this listing — price, zoning, demand, history. Ask anything.






Frequently Asked Questions
What type of property is this?
Apartment building - Historic urban property with a diverse studio and one- and two-bedroom unit mix near Portland’s NW 23rd and NW 21st corridors.
Where is this apartment building located?
The property is located at 1964 NW Johnson St Portland, OR.
What is the asking price?
The asking price for this property is $2,000,000.
What are key features of this property?
This property features: 19‑unit apartment building constructed in 1927; Unit mix includes 16 studios, 2 one‑bedrooms, and 1 two‑bedroom unit; Located at 1964 NW Johnson St in Portland, OR 97209



