Stucco Mixed-Use
For Sale
$450,000
1964 Carolina Beach Rd, Wilmington, NC 28401
CB zoning supports residential use, professional office space, boutique retail, services, and adaptive reuse.
Property Size2,334 SF
Price / SF$192.80
Days on Market47
Property Features for 1964 Carolina Beach Rd
General Information
Standard status
Active
Size
2,334 SF
Property subtype
Business Opportunity
Zoning
CB
Site & Location
Neighborhood
Sunset Park / Woodlawn
Building Details
Year Built
1921
Construction
stucco
Listing Agency:
Hanover Real Estate Partners
Listed By:
Chip W Moore · License #280292
(910) 279-6584
Source:
Bradberrygarnerrealestate
Added: Sep 7
Changed: Oct 2
Last Checked: Oct 7 at 5:38PM
Displayed information is deemed reliable but is not guaranteed and should be independently verified. All listing content including descriptions, pricing, images are the copyrighted material of Hanover Real Estate Partners

Ask AI about this property
Review the available facts, identify missing information and prepare questions for the agent.
Investment Insights
Based on property information with market context.
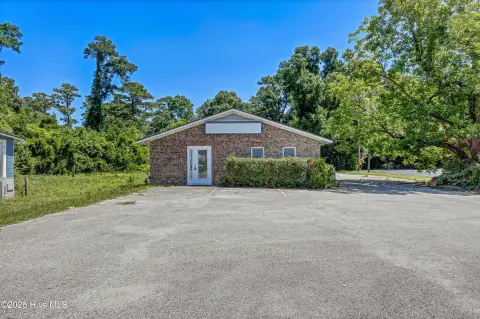
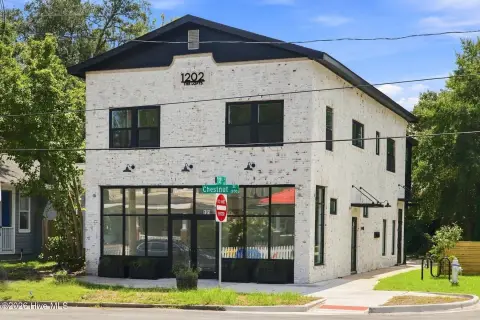
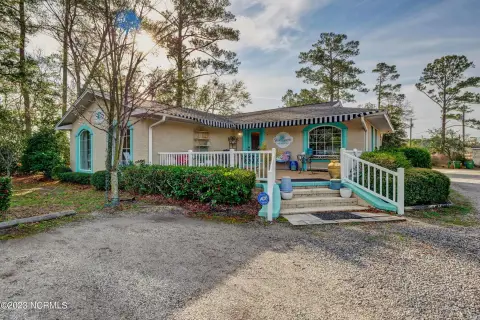
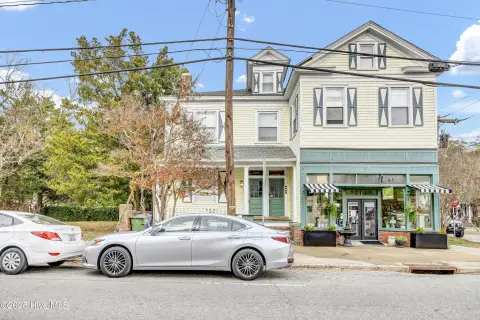
Located at 1964 Carolina Beach Rd in Wilmington, this 2,334-square-foot mixed-use property occupies a European-style stucco building constructed in 1921. Period architectural details and the original residential character create a distinctive setting for continued residential occupancy or conversion to a commercial format.
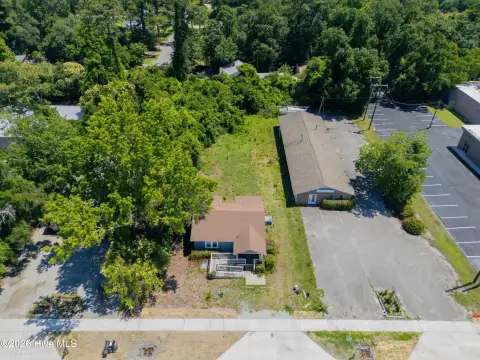
Community Business (CB) zoning supports a range of neighborhood-oriented applications, including professional offices, boutique retail, service businesses, and other adaptive reuse options. The property is near Sunset Park and Greenfield Lake, with routes toward downtown Wilmington and the beaches. Its existing structure and flexible zoning provide a foundation for an owner-occupant, investor, or business seeking a character-rich space with multiple use possibilities.
Community Business (CB) zoning supports a range of neighborhood-oriented applications, including professional offices, boutique retail, service businesses, and other adaptive reuse options. The property is near Sunset Park and Greenfield Lake, with routes toward downtown Wilmington and the beaches. Its existing structure and flexible zoning provide a foundation for an owner-occupant, investor, or business seeking a character-rich space with multiple use possibilities.
Key Highlights
- 2,334 square feet of building area
- Constructed in 1921 with period architectural details
- European‑style stucco exterior
Financial Insights
Estimated NOI and Cap Rate
NOI / Yr
$29,642
Cap Rate
6.59%
Suggested Prices Based on Cap Rates
Cap Rate 5%
$592,840
$592.8K
Cap Rate 7%
$423,457
$423.5K
Cap Rate 9%
$329,356
$329.4K
Market Conditions
NOI Build-Up for 2,334 SF
Gross rent
$48.7K $20.88/SF
− Vacancy
−$9.2K −$3.95/SF
EGI
$39.5K $16.93/SF
− OpEx
−$9.9K −$4.23/SF
NOI
$29.6K $12.70/SF
Area
Wilmington, NC
Vacancy
18.90%
Lease Rate
$20.88 /SF/Yr
Expense Ratio
25.00%
Simulate Cap Rate and NOI
Suggested Prices Based on Cap Rates
Cap Rate 5%
$592,840
Cap Rate 7%
$423,457
Cap Rate 9%
$329,356
Alternative Uses
Best Use
Mixed Use
$28.14M
$24.63M – $32.84M
NOI $1,970,138 @ 7.0% cap · market cap 437.81%
Second Best
Office B
$423.5K
$370.5K – $494.0K
NOI $29,642 @ 7.0% cap · market cap 6.59%
Theoretical Best
Multifamily LT 5
$28.58M
$25.01M – $33.34M
NOI $2,000,492 @ 7.0% cap · market cap 444.55%
Zoning and permitted uses should be independently verified with authorities.
How Realmo checks its estimates
Property Analytics
Who owns this building?
See the owner, sales and loan history
Open Analytics
Current Use
Location Intelligence
Trade Area within ½ mile
425
Businesses Nearby
Explore this area
Business Placement
Demographics for 28401, NC
22,204
Population
13,017
Households
1.7
Avg Household Size
41
Median Age
34%
College-Educated
88%
High-School Grad
31.0 sq mi
ZIP Area
716
Density / Sq Mi
$52,159
Median Household Income
$35,739
Median Earnings
$1,183
Median Rent
$263,000
Median Home Value
Check the figures for this property
Cap Rate, Value Estimation, Potential NOI and more
View Realmo Analytics
Market
Vacancy Rate% for Office in South region






Frequently Asked Questions
What type of property is this?
Mixed-use property - CB zoning supports residential use, professional office space, boutique retail, services, and adaptive reuse.
Where is this mixed-use property located?
The property is located at 1964 Carolina Beach Rd Wilmington, NC.
What is the asking price?
The asking price for this property is $450,000.
What are key features of this property?
This property features: 2,334 square feet of building area; Constructed in 1921 with period architectural details; European‑style stucco exterior


