Remodeled Residential Income
For Sale
$149,900
1940 4th Street, Sparks, NV 89431
Residential, Sparks, NV
Property Size940 SF
Lot Size0.02 Acres
Price / SF$159.47
Days on Market98
Property Features for 1940 4th Street
General Information
Property type
Residential Multi Family
Property subtype
Other
Zoning
MF4
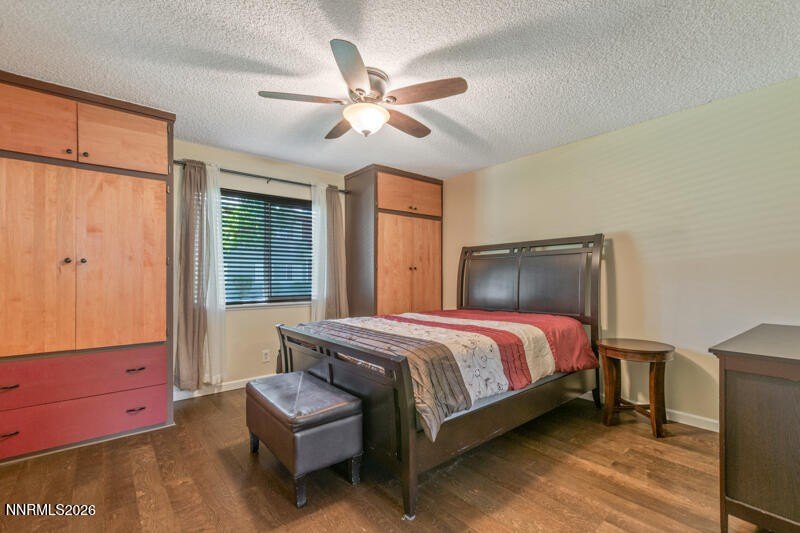
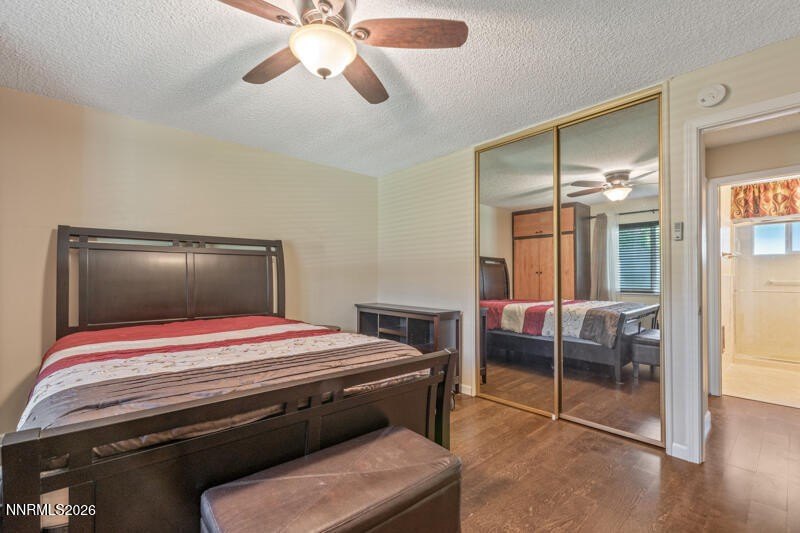
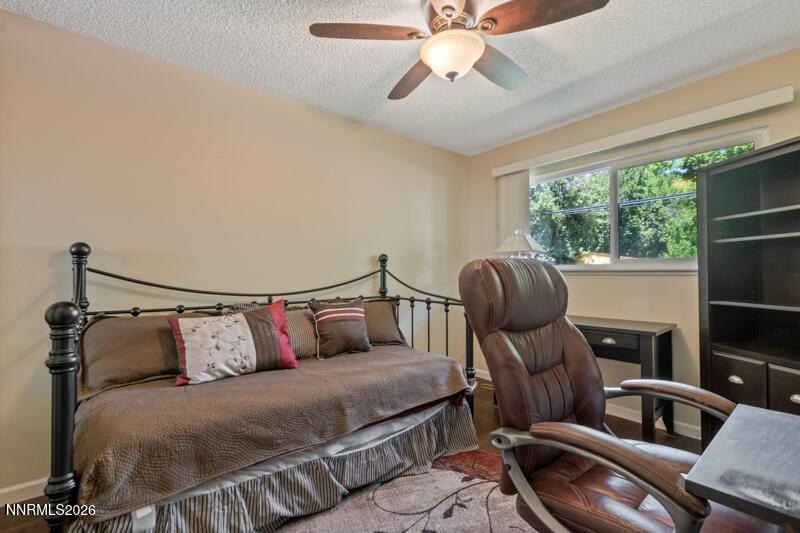
Bedrooms
2
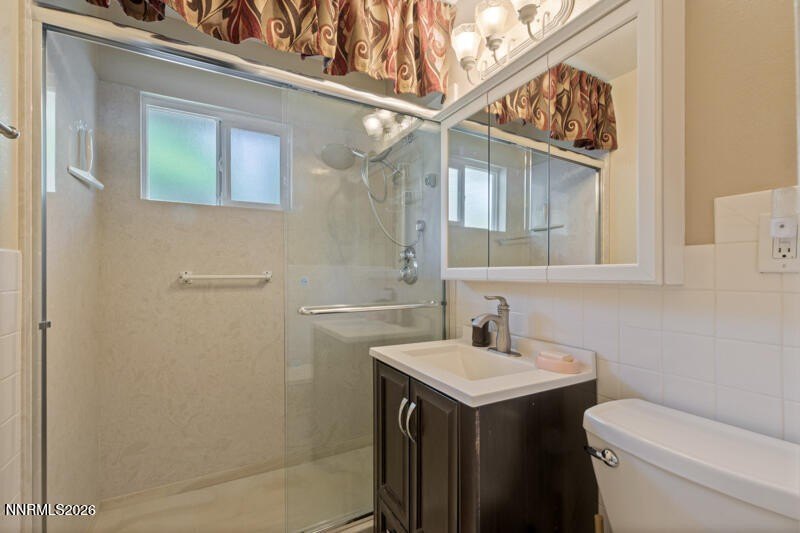
Bathrooms
1
Full bathrooms
1
Rooms
Bedroom 2, Bathroom 1, Bedroom 1
Parking
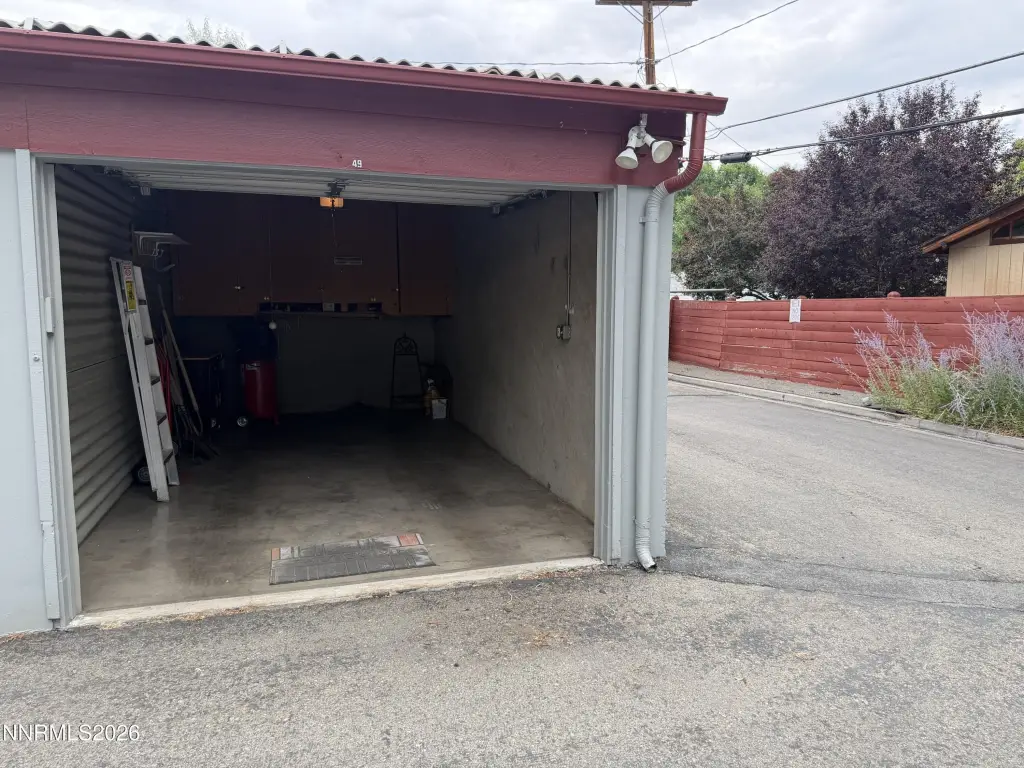
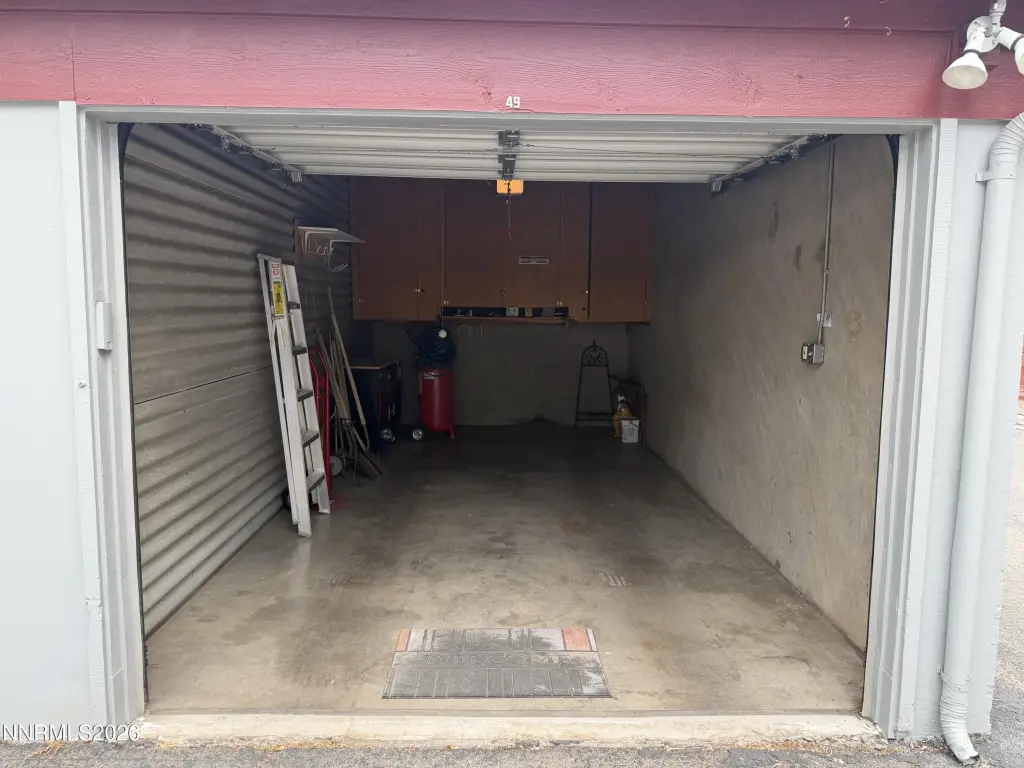
1
Parking features
Garage
Window features
Blinds, Drapes, Vinyl Frames, Double Pane Windows
Patio and Porch features
Patio, Porch
Interior features
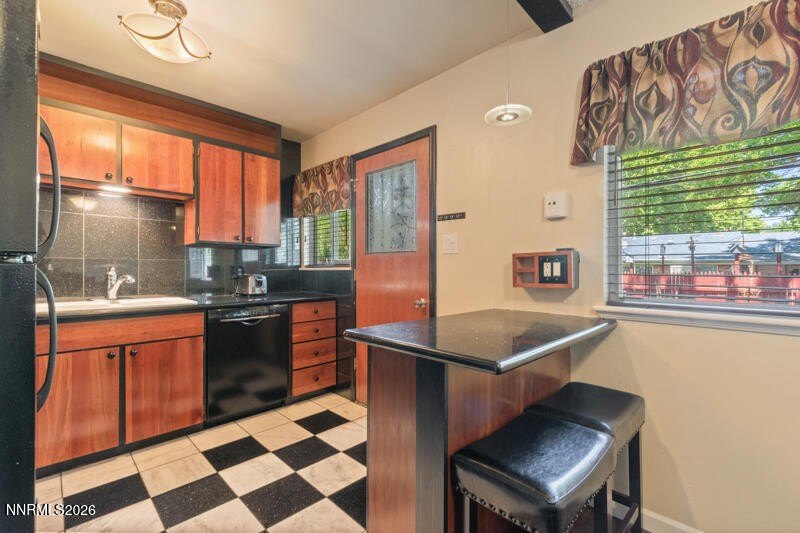
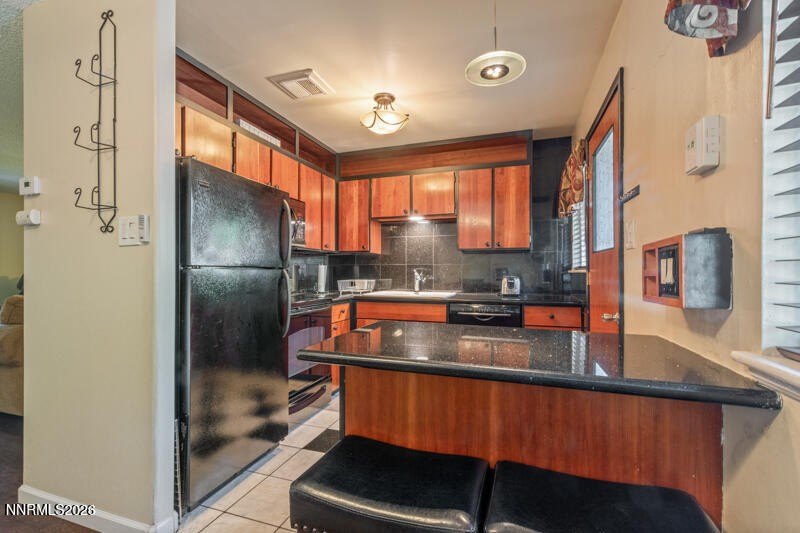
Breakfast Bar, Ceiling Fan(s), Pantry
Fireplace
1
Appliances
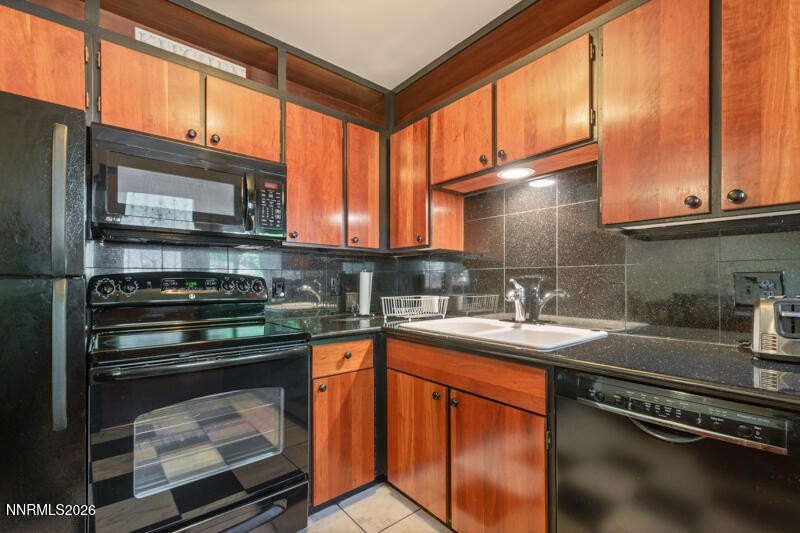
Dishwasher, Disposal, Electric Cooktop, Electric Oven, Electric Range, Microwave, Refrigerator
Lot features
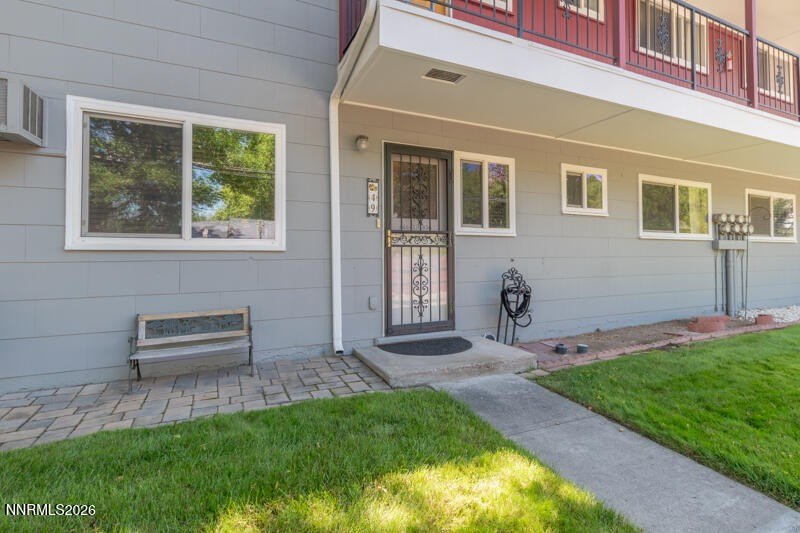
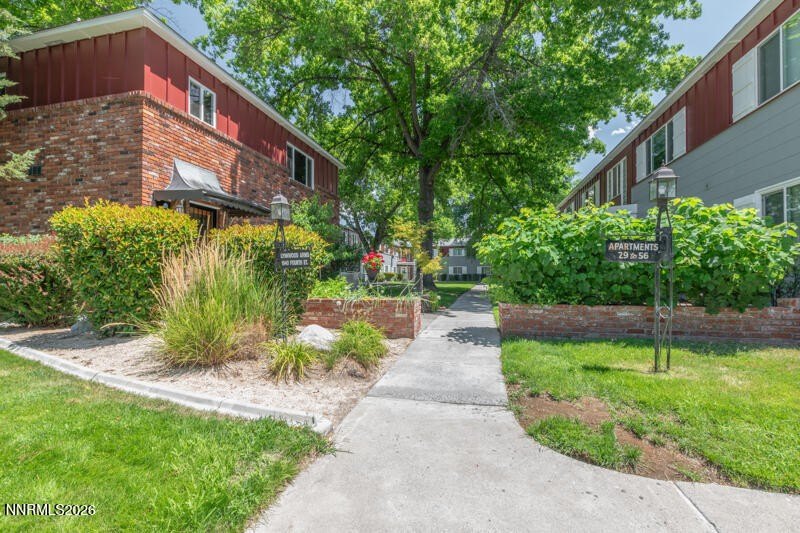
Common Area, Greenbelt, Landscaped, Level, Sprinklers In Front, Sprinklers In Rear
View
City, Park
Elementary school
Greenbrae
Middle school
Dilworth
High school
Sparks
Directions
Pyramid to Greenbrae to 4th st
Standard status
Active
APN
028-321-02
Size
940 SF
Lot size
0.02 Acres
Taxes and HOA fees
HOA Fee
$500 Monthly
Utilities
Utilities
Cable Available
Sewer type
Public Sewer
Heating system
Wall Furnace, Fireplace(s)
Cooling system
Wall/Window Unit(s), Window Unit(s)
Water source
Public
Building Details
Year built
1960
Floors in Building
1
Flooring type
Wood
Roof type
Composition, Shingle
Listing Agency:
Ferrari-Lund Real Estate Reno
(775) 688-4000
Listed By:
Jennifer Scott · License #S.171194
(775) 772-7098
Added: Jul 14
Changed: Oct 2
Last Checked: Oct 19 at 3:06PM
MLS# 260008999
Copyright © 2026 Northern Nevada Regional MLS, Inc. All rights reserved. All information provided by the listing agent/broker is deemed reliable but is not guaranteed and should be independently verified.

Ask AI about this property
Review the available facts, identify missing information and prepare questions for the agent.
Investment Insights
Based on property information with market context.
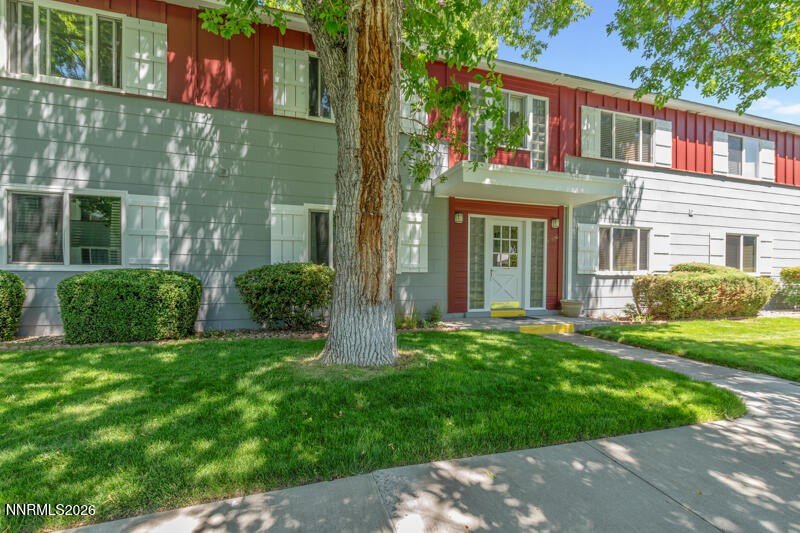
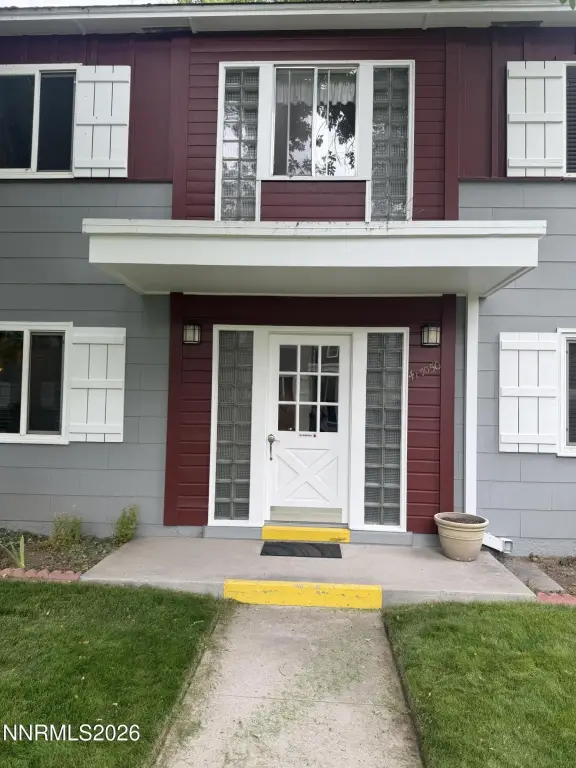
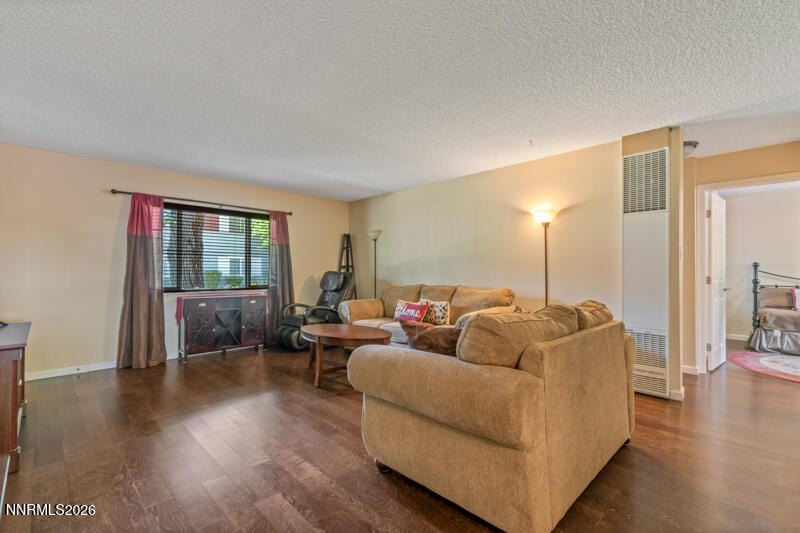
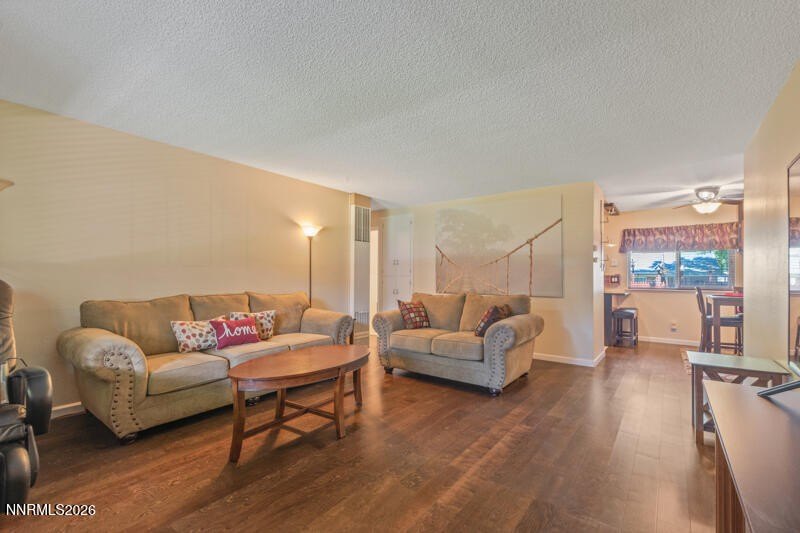
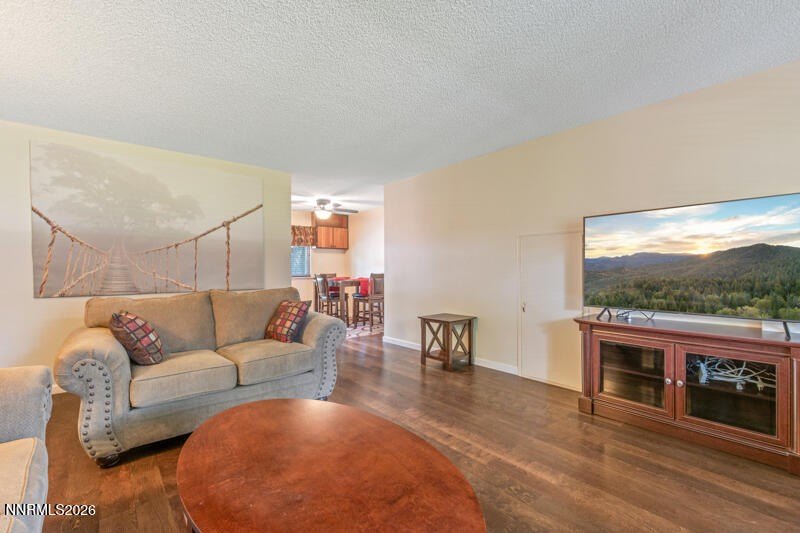
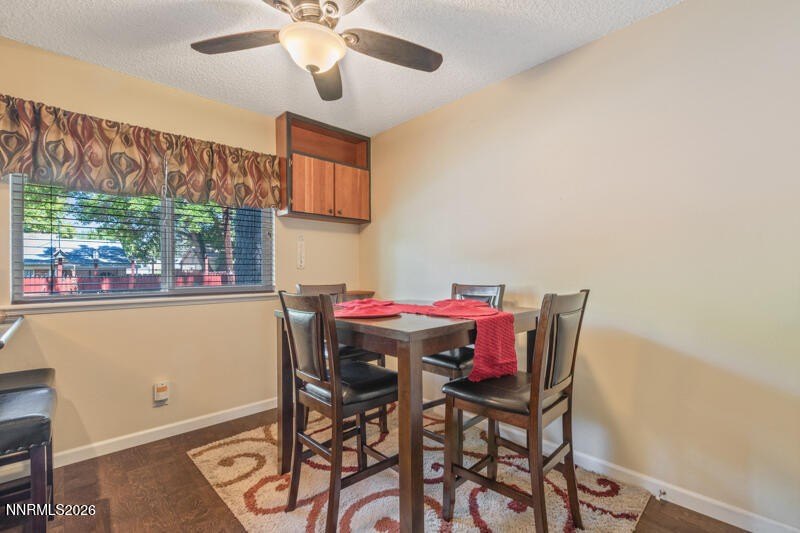
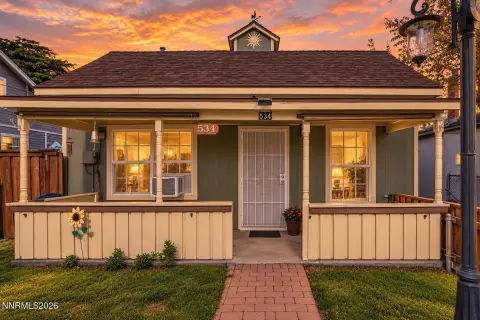
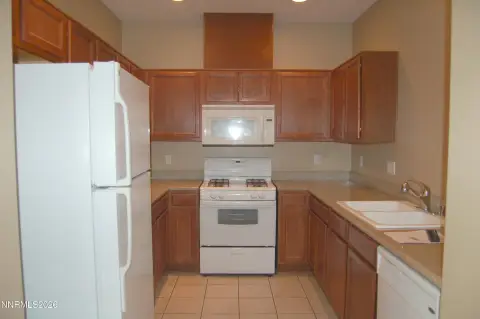
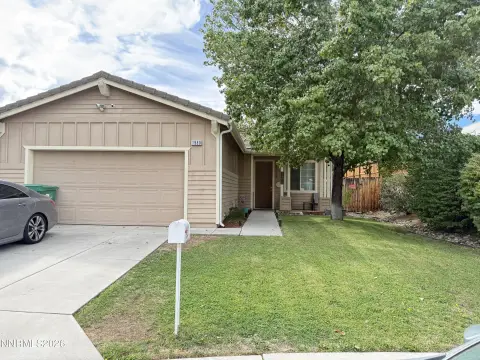
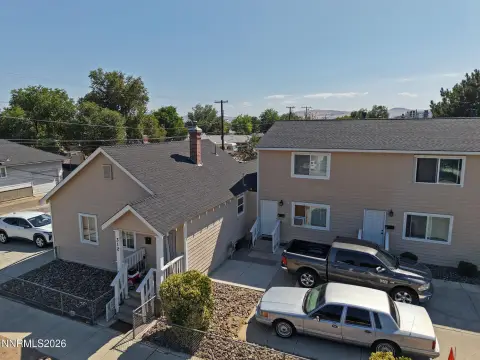
This remodeled first-floor condominium offers approximately 940 square feet with two bedrooms and one bathroom. The interior includes wood flooring, a breakfast bar, pantry, ceiling fan, fireplace, wall furnace, and wall or window-unit cooling. The kitchen is equipped with a dishwasher, disposal, electric cooktop, electric oven, electric range, microwave, and refrigerator. A patio and porch extend the usable living area, while garage parking is also provided.
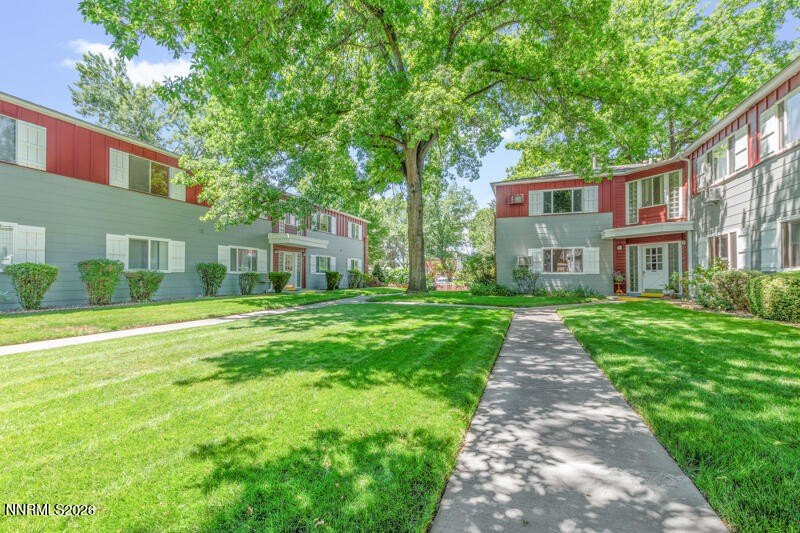
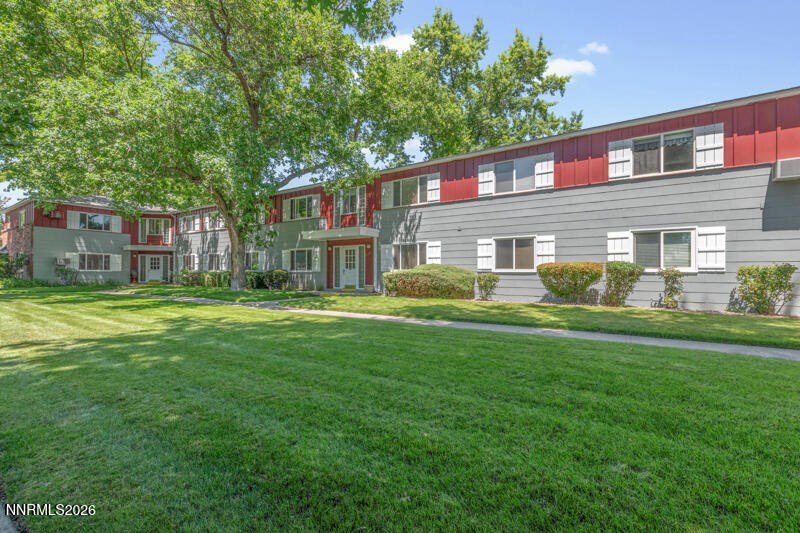
The property is located in a senior community with mature landscaping and shared community upkeep. The HOA includes property taxes, and the community does not permit pets. Occupancy is restricted to the owner, so the unit cannot be rented. Public water and sewer serve the property, with cable available. Built in 1960, the condominium also features a shingle and composition roof.
The property is located in a senior community with mature landscaping and shared community upkeep. The HOA includes property taxes, and the community does not permit pets. Occupancy is restricted to the owner, so the unit cannot be rented. Public water and sewer serve the property, with cable available. Built in 1960, the condominium also features a shingle and composition roof.
Key Highlights
- Approximately 940 square feet with 2 bedrooms and 1 bathroom
- Remodeled first‑floor condominium in a senior community
- Owner occupancy required; unit cannot be rented
Financial Insights
Estimated NOI and Cap Rate
NOI / Yr
$10,460
Cap Rate
6.98%
Suggested Prices Based on Cap Rates
Cap Rate 5%
$209,200
$209.2K
Cap Rate 7%
$149,429
$149.4K
Cap Rate 9%
$116,222
$116.2K
Market Conditions
NOI Build-Up for 940 SF
Gross rent
$19.9K $21.12/SF
− Vacancy
−$834 −$0.89/SF
EGI
$19.0K $20.23/SF
− OpEx
−$8.6K −$9.10/SF
NOI
$10.5K $11.13/SF
Area
Sparks, NV
Vacancy
4.20%
Lease Rate
$21.12 /SF/Yr
Expense Ratio
45.00%
Simulate Cap Rate and NOI
Suggested Prices Based on Cap Rates
Cap Rate 5%
$209,200
Cap Rate 7%
$149,429
Cap Rate 9%
$116,222
Alternative Uses
Best Use
Apartment 5plus
$149.4K
$130.8K – $174.3K
NOI $10,460 @ 7.0% cap · market cap 6.98%
Second Best
—
—
no second resolved use
Theoretical Best
Specialty Retail
$332.7K
$291.1K – $388.2K
NOI $23,291 @ 7.0% cap · market cap 15.54%
Zoning and permitted uses should be independently verified with authorities.
How Realmo checks its estimates
Property Analytics
Unlock full access to Insights
Subscribe to Realmo Intelligence
Open Analytics
Lease Details
1
Residential units
Location Intelligence
Trade Area within ½ mile
588
Businesses Nearby
Explore this area
Business Placement
Demographics for 89431, NV
40,219
Population
16,858
Households
2.4
Avg Household Size
35
Median Age
14%
College-Educated
76%
High-School Grad
9.2 sq mi
ZIP Area
4,372
Density / Sq Mi
$64,496
Median Household Income
$39,589
Median Earnings
$1,276
Median Rent
$332,000
Median Home Value
Check the figures for this property
Cap Rate, Value Estimation, Potential NOI and more
View Realmo Analytics



Frequently Asked Questions
What type of property is this?
Residential income property - Updated first-floor condominium in a senior community with private outdoor space and owner-occupancy requirements.
Where is this residential income property located?
The property is located at 1940 4th Street Sparks, NV.
What is the asking price?
The asking price for this property is $149,900.
What are key features of this property?
This property features: Approximately 940 square feet with 2 bedrooms and 1 bathroom; Remodeled first‑floor condominium in a senior community; Owner occupancy required; unit cannot be rented


