Downtown Brick Apartment
For Sale
$699,900
194 3RD Street, Troy, NY 12180
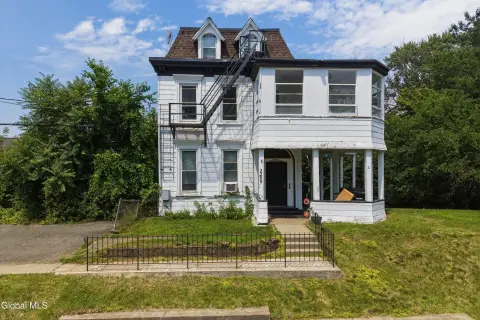
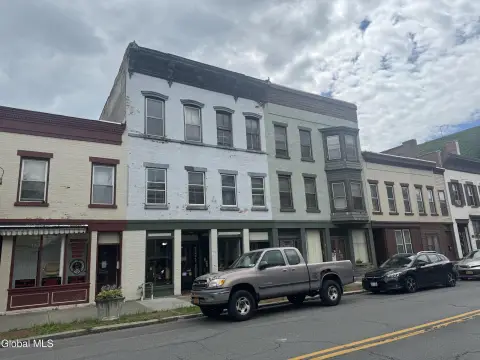
Historic 7-unit brick apartment building with hardwood floors, updated units, and a shared backyard plus garage access.
Property Size3,693 SF
Price / SF$189.52
Days on Market142
Property Features for 194 3RD Street
General Information
Standard status
Active
Size
3,693 SF
Property subtype
Multi-family
Building Details
Year Built
1920
Listing Agency:
KW Platform
Listed By:
Kristian Khachadourian · License #10401303476
(518) 937-4124
Source:
Signatureonerealtygroup
Added: May 31
Changed: Oct 16
Last Checked: Oct 16 at 8:41AM
Displayed information is deemed reliable but is not guaranteed and should be independently verified. All listing content including descriptions, pricing, images are the copyrighted material of KW Platform

Ask AI about this property
Review the available facts, identify missing information and prepare questions for the agent.
Investment Insights
Based on property information with market context.
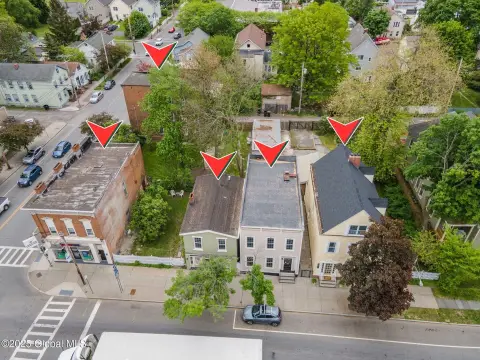
This historic brick 7-unit apartment building was converted into apartments while preserving original character elements such as original woodwork and hardwood floors throughout. Each unit has been updated over time, with layouts described as generous and offering lots of natural light. The property also includes a large shared yard in back and a garage accessible from Church St.
Located in downtown Troy, the building is positioned for walkability to local amenities and is noted as being steps from Washington Park.
The property is fully rented, supporting immediate income.
Located in downtown Troy, the building is positioned for walkability to local amenities and is noted as being steps from Washington Park.
The property is fully rented, supporting immediate income.
Key Highlights
- Historic brick 7‑unit apartment building built in 1920
- Original characteristics retained, including original woodwork and hardwood floors throughout
- Each apartment has been updated over time; property is well cared for
Financial Insights
Estimated NOI and Cap Rate
NOI / Yr
$44,826
Cap Rate
6.40%
Suggested Prices Based on Cap Rates
Cap Rate 5%
$896,520
$896.5K
Cap Rate 7%
$640,371
$640.4K
Cap Rate 9%
$498,067
$498.1K
Market Conditions
NOI Build-Up for 3,693 SF
Gross rent
$86.0K $23.28/SF
− Vacancy
−$4.5K −$1.21/SF
EGI
$81.5K $22.07/SF
− OpEx
−$36.7K −$9.93/SF
NOI
$44.8K $12.14/SF
Area
Rensselaer County, NY
Vacancy
5.20%
Lease Rate
$23.28 /SF/Yr
Expense Ratio
45.00%
Simulate Cap Rate and NOI
Suggested Prices Based on Cap Rates
Cap Rate 5%
$896,520
Cap Rate 7%
$640,371
Cap Rate 9%
$498,067
Alternative Uses
Best Use
Apartment 5plus
$640.4K
$560.3K – $747.1K
NOI $44,826 @ 7.0% cap · market cap 6.40%
Second Best
—
—
no second resolved use
Theoretical Best
Office A
$923.2K
$807.8K – $1.08M
NOI $64,623 @ 7.0% cap · market cap 9.23%
Zoning and permitted uses should be independently verified with authorities.
How Realmo checks its estimates
Property Analytics
Unlock full access to Insights
Subscribe to Realmo Intelligence
Open Analytics
Location Intelligence
Trade Area within ½ mile
1,758
Businesses Nearby
Explore this area
Business Placement
Demographics for 12180, NY
55,907
Population
25,527
Households
2.2
Avg Household Size
33
Median Age
40%
College-Educated
90%
High-School Grad
56.2 sq mi
ZIP Area
995
Density / Sq Mi
$73,767
Median Household Income
$41,787
Median Earnings
$1,188
Median Rent
$233,000
Median Home Value
Check the figures for this property
Cap Rate, Value Estimation, Potential NOI and more
View Realmo Analytics
Market
Vacancy Rate% for Multifamily in Northeast region


Frequently Asked Questions
What type of property is this?
Apartment building - Historic 7-unit brick apartment building with hardwood floors, updated units, and a shared backyard plus garage access.
Where is this apartment building located?
The property is located at 194 3RD Street Troy, NY.
What is the asking price?
The asking price for this property is $699,900.
What are key features of this property?
This property features: Historic brick 7‑unit apartment building built in 1920; Original characteristics retained, including original woodwork and hardwood floors throughout; Each apartment has been updated over time; property is well cared for


