New-Build Flex
For Sale
$2,850,000
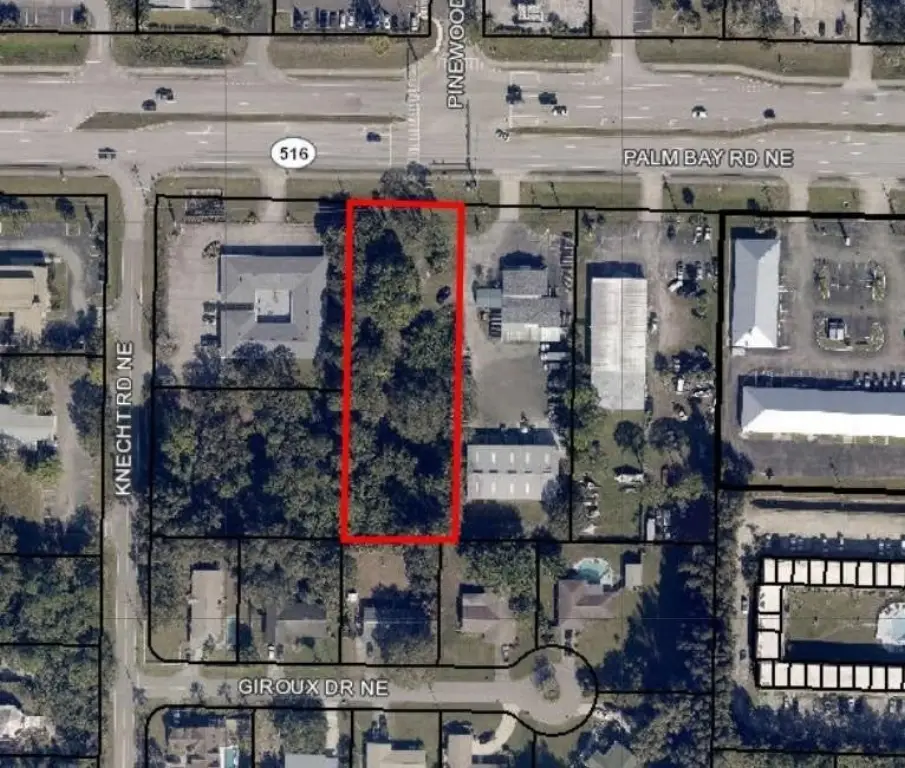
1922 NE Palm Bay Road, Palm Bay, FL 32905
Palm Bay, FL
Property Size10,000 SF
Price / SF$285
Days on Market48
Property Features for 1922 NE Palm Bay Road
General Information
Property type
Commercial Sale
Property subtype
Other
Standard status
Active
Building Details
Year built
2026
Listing Agency:
Engel & Volkers Hutchinson Island · Engel & Völkers
(772) 410-4155
Listed By:
Richard Angelo Bettencourt
Added: Sep 9
Changed: Oct 9
Last Checked: Oct 26 at 2:06PM
MLS# F10555949
Copyright © 2026 Engel & Völkers. All rights reserved. All information provided by the listing agent/broker is deemed reliable but is not guaranteed and should be independently verified.

Ask AI about this property
Review the available facts, identify missing information and prepare questions for the agent.
Investment Insights
Based on property information with market context.
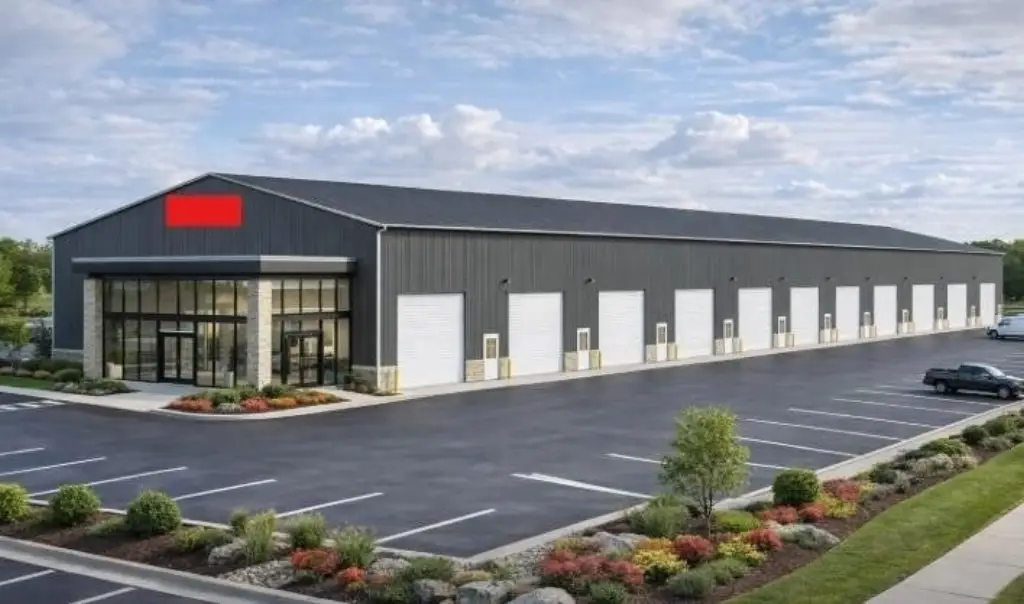
Scheduled for completion in 2026, this freestanding 10K flex-space property combines front-facing retail space with a planned multi-bay layout. The concept allows for build-to-suit occupancy by an end user or a multi-tenant configuration, with as many as 10 bays contemplated.
Water and electric are stubbed to each unit, supporting the proposed bay arrangement. The property is located on Palm Bay Road in Palm Bay, Florida, providing a commercial setting for the planned retail and flex-space components.
Water and electric are stubbed to each unit, supporting the proposed bay arrangement. The property is located on Palm Bay Road in Palm Bay, Florida, providing a commercial setting for the planned retail and flex-space components.
Key Highlights
- 10K freestanding flex‑space build scheduled for 2026
- Front retail component with a planned configuration of up to 10 bays
- Build‑to‑suit concept supports end‑user or multi‑tenant occupancy
Financial Insights
Estimated NOI and Cap Rate
NOI / Yr
$115,290
Cap Rate
4.05%
Suggested Prices Based on Cap Rates
Cap Rate 5%
$2,305,800
$2.3M
Cap Rate 7%
$1,647,000
$1.6M
Cap Rate 9%
$1,281,000
$1.3M
Market Conditions
NOI Build-Up for 10,000 SF
Gross rent
$180.0K $18.00/SF
− Vacancy
−$15.3K −$1.53/SF
EGI
$164.7K $16.47/SF
− OpEx
−$49.4K −$4.94/SF
NOI
$115.3K $11.53/SF
Area
Palm Bay, FL
Vacancy
8.50%
Lease Rate
$18.00 /SF/Yr
Expense Ratio
30.00%
Simulate Cap Rate and NOI
Suggested Prices Based on Cap Rates
Cap Rate 5%
$2,305,800
Cap Rate 7%
$1,647,000
Cap Rate 9%
$1,281,000
Alternative Uses
Best Use
Retail
$1.65M
$1.44M – $1.92M
NOI $115,290 @ 7.0% cap · market cap 4.05%
Second Best
Flex RnD
$1.46M
$1.28M – $1.70M
NOI $102,102 @ 7.0% cap · market cap 3.58%
Theoretical Best
Office A
$2.64M
$2.31M – $3.08M
NOI $184,680 @ 7.0% cap · market cap 6.48%
Zoning and permitted uses should be independently verified with authorities.
How Realmo checks its estimates
Property Analytics
Contact the owner directly
Get the owner's phone numbers and email
Open Analytics
Current Use
Lease Details
Yes
Utilities to site
Location Intelligence
Trade Area within ½ mile
1,175
Businesses Nearby
Under-served
Demand for This Use
Explore this area
Business Placement
Demographics for 32905, FL
26,064
Population
12,635
Households
2.1
Avg Household Size
45
Median Age
27%
College-Educated
91%
High-School Grad
9.7 sq mi
ZIP Area
2,687
Density / Sq Mi
$56,671
Median Household Income
$31,688
Median Earnings
$1,361
Median Rent
$206,200
Median Home Value
Check the figures for this property
Cap Rate, Value Estimation, Potential NOI and more
View Realmo Analytics
Market
Vacancy Rate% for Industrial in South region


Similar Off Market Nearby
- Dna floribbean flavors — 4502 babcock st ne, palm bay, fl 32905
Frequently Asked Questions
What type of property is this?
Flex space - Freestanding commercial property with front retail space and a flexible multi-bay configuration.
Where is this flex space located?
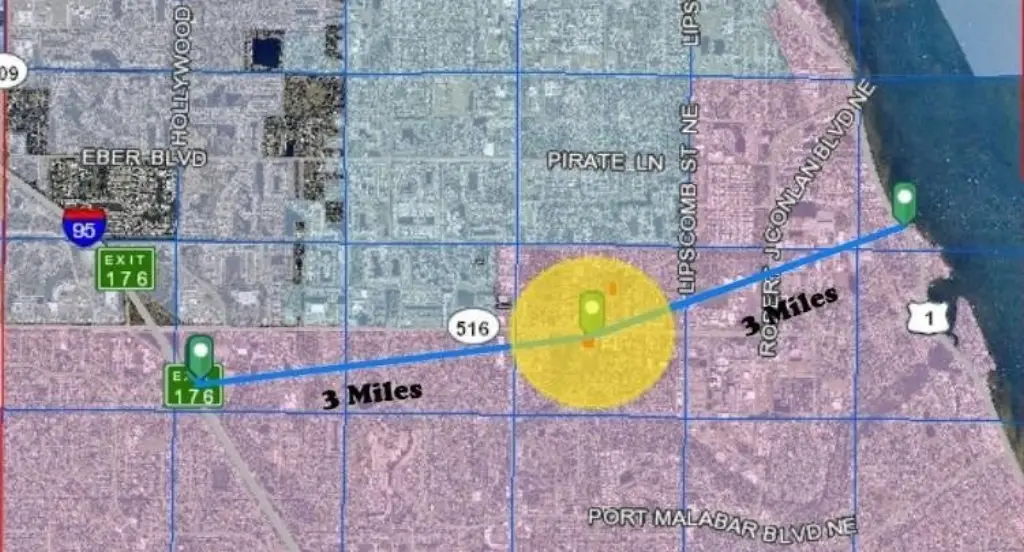
The property is located at 1922 NE Palm Bay Road Palm Bay, FL.
What is the asking price?
The asking price for this property is $2,850,000.
What are key features of this property?
This property features: 10K freestanding flex‑space build scheduled for 2026; Front retail component with a planned configuration of up to 10 bays; Build‑to‑suit concept supports end‑user or multi‑tenant occupancy



