Five-Unit Retail
For Sale
$1,450,000
1921 Morris Ave, Union, NJ 07083
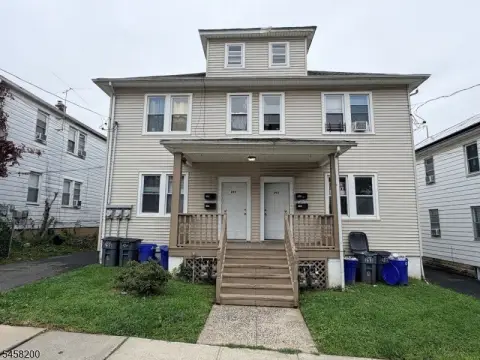
Five separate retail units with independent utilities, entrances, and parking support a flexible owner-occupier or investment strategy.
Property Size3,870 SF
Price / SF$374.68
Days on Market100
Property Features for 1921 Morris Ave
General Information
Standard status
Active
Size
3,870 SF
Total Parking Spaces
12
Property subtype
Commercial
Additional Details
Commercial Hood
Yes
Taxes and HOA fees
Annual Taxes
$18,121
Amenities
Central air
4+ Units Cooling
4+ Units Heating
Blacktop Driveway
Central Air Cooling
Flat Roof
Forced Hot Air Heating
Heatpump Cooling
Parking Lot-Exclusive
Wall A/C Unit(s) Cooling
Building Details
Year Built
1920
Tenancy
Multi
Listing Agency:
COLDWELL BANKER REALTY
(908) 233-5555
Listed By:
ALAN A. RASMUSSEN
(908) 451-2844
Source:
Corcoran
Added: Jun 29
Changed: Oct 4
Last Checked: Oct 5 at 6:22PM
Displayed information is deemed reliable but is not guaranteed and should be independently verified. All listing content including descriptions, pricing, images are the copyrighted material of COLDWELL BANKER REALTY
Investment Insights
Based on property information with market context.
This five-unit retail building offers a practical, divisible setup with each unit having its own utilities, basement space, bathrooms, and front and rear entrances. Building systems are currently configured by unit: Units 1 and 2 share a gas furnace CAC, Units 3 and 4 use wall-mounted heat pump AC units, and Unit 5 has its own gas furnace CAC and is currently leased on a month-to-month basis. The building also includes a hard-wired, central monitored fire alarm. In addition, Unit 1 features a full kitchen with hood and a front counter area, and Unit 2 includes a full kitchen hood. A 12-car private parking lot and building signage are included, and the owner is replacing the roof.
Located on a busy Rt 82 corridor in Union Township, the property is positioned on the corner of Morris and Grandview Avenues, providing strong visibility and straightforward access for retail customers and deliveries.
The layout and separate utilities make this building well-suited for an owner-occupier who wants on-site control while generating income from additional units, or for an investor seeking a small multi-tenant retail structure with individually metered spaces. Roof replacement and existing life-safety infrastructure further support near-term operational continuity.
Located on a busy Rt 82 corridor in Union Township, the property is positioned on the corner of Morris and Grandview Avenues, providing strong visibility and straightforward access for retail customers and deliveries.
The layout and separate utilities make this building well-suited for an owner-occupier who wants on-site control while generating income from additional units, or for an investor seeking a small multi-tenant retail structure with individually metered spaces. Roof replacement and existing life-safety infrastructure further support near-term operational continuity.
Key Highlights
- Five‑unit retail building on busy Rt 82 in Union Town Center (corner of Morris and Grandview Avenues)
- Each unit has its own utilities, basements, bathrooms, and front/rear entrances for separate leasing or space division
- Unit 1 & 2 share a gas furnace/cac; Units 3 & 4 have wall‑mounted heat pump/AC units; Unit 5 has its own gas furnace/cac
Financial Insights
Estimated NOI and Cap Rate
NOI / Yr
$59,183
Cap Rate
4.08%
Suggested Prices Based on Cap Rates
Cap Rate 5%
$1,183,660
$1.2M
Cap Rate 7%
$845,471
$845.5K
Cap Rate 9%
$657,589
$657.6K
Market Conditions
NOI Build-Up for 3,870 SF
Gross rent
$83.6K $21.60/SF
− Vacancy
−$4.7K −$1.21/SF
EGI
$78.9K $20.39/SF
− OpEx
−$19.7K −$5.10/SF
NOI
$59.2K $15.29/SF
Area
Union County, NJ
Vacancy
5.60%
Lease Rate
$21.60 /SF/Yr
Expense Ratio
25.00%
Simulate Cap Rate and NOI
Suggested Prices Based on Cap Rates
Cap Rate 5%
$1,183,660
Cap Rate 7%
$845,471
Cap Rate 9%
$657,589
Alternative Uses
Best Use
Specialty Retail
$845.5K
$739.8K – $986.4K
NOI $59,183 @ 7.0% cap · market cap 4.08%
Second Best
Retail
$789.1K
$690.5K – $920.6K
NOI $55,238 @ 7.0% cap · market cap 3.81%
Theoretical Best
Office A
$1.01M
$884.2K – $1.18M
NOI $70,737 @ 7.0% cap · market cap 4.88%
Zoning and permitted uses should be independently verified with authorities.
Property Analytics
Unlock full access to Insights
Subscribe to Realmo Intelligence
Open Analytics
Current Use
Lease Details
Multi-tenant
Tenancy
Yes
Commercial hood
Location Intelligence
Trade Area within ½ mile
1,367
Businesses Nearby
160k
Monthly Visits Nearby
Under-served
Demand for This Use
Explore this area
Business Placement
Foot Traffic Nearby
Shops & Services 41%
Groceries 26%
Dining 23%
Apparel 6%
Stop & Shop
Groceries
42,314 visits/mo
0.2 miles
Applebee's
Dining
18,681 visits/mo
0.4 miles
Capital One Bank
Shops & Services
17,203 visits/mo
0.4 miles
QuickChek
Shops & Services
13,590 visits/mo
0.2 miles
Ashley Stewart
Apparel
10,081 visits/mo
0.4 miles
Demographics for 07083, NJ
56,131
Population
20,792
Households
2.7
Avg Household Size
41
Median Age
41%
College-Educated
89%
High-School Grad
8.7 sq mi
ZIP Area
6,452
Density / Sq Mi
$118,106
Median Household Income
$58,443
Median Earnings
$1,938
Median Rent
$425,600
Median Home Value
Check the figures for this property
Cap Rate, Value Estimation, Potential NOI and more
View Realmo Analytics
Market
Vacancy Rate% for Retail in Northeast region

Questions? Ask Rey
Realmo’s AI knows this listing — price, zoning, demand, history. Ask anything.




Similar Off Market Nearby
- VAMA International African Market — 1055 Stuyvesant Ave., Union, NJ 07083
Frequently Asked Questions
What type of property is this?
Grocery and convenience store - Five separate retail units with independent utilities, entrances, and parking support a flexible owner-occupier or investment strategy.
Where is this grocery and convenience store located?
The property is located at 1921 Morris Ave Union, NJ.
What is the asking price?
The asking price for this property is $1,450,000.
What are key features of this property?
This property features: Five‑unit retail building on busy Rt 82 in Union Town Center (corner of Morris and Grandview Avenues); Each unit has its own utilities, basements, bathrooms, and front/rear entrances for separate leasing or space division; Unit 1 & 2 share a gas furnace/cac; Units 3 & 4 have wall‑mounted heat pump/AC units; Unit 5 has its own gas furnace/cac



