Fayetteville Retail Property Near
For Sale
$425,000
1917 Ramsey St, Fayetteville, NC 28301
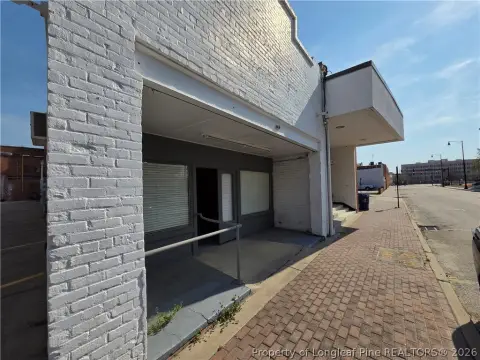
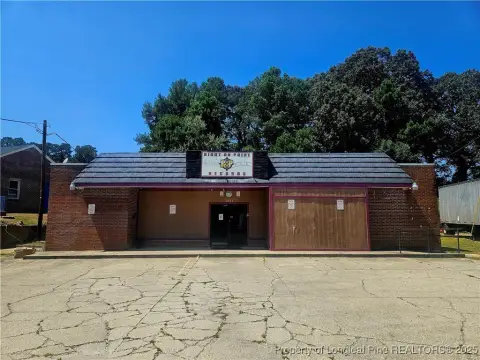
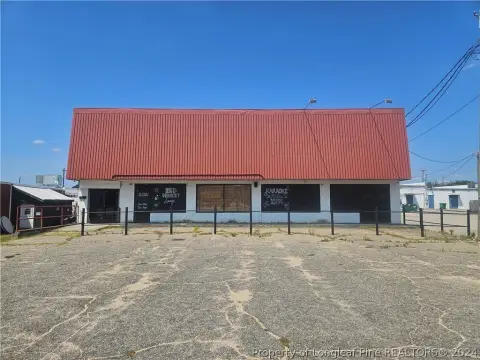
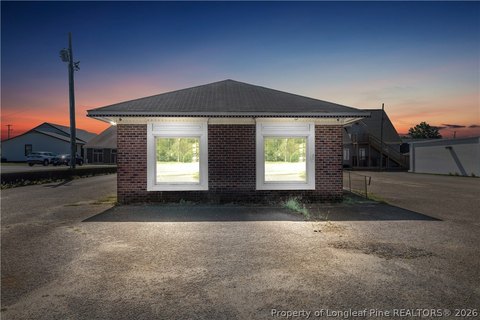
Two buildings on 1.77 acres near downtown Fayetteville.
Property Size3,020 SF
Lot Size1.77 Acres
Price / SF$140.73
Days on Market212
Property Features for 1917 Ramsey St
General Information
Standard status
Active
Size
3,020 SF
Lot size
1.77 Acres
Property subtype
Retail
Building Details
Building Size
3,020 SF
Year Built
1976
Listing Agency:
Grant-Murray Real Estate
Listed By:
Neil Grant · License #208918
(910) 818-3252
Source:
Grantmurrayre
Added: Mar 26
Changed: Oct 3
Last Checked: Oct 20 at 7:04PM
Displayed information is deemed reliable but is not guaranteed and should be independently verified. All listing content including descriptions, pricing, images are the copyrighted material of Grant-Murray Real Estate

Ask AI about this property
Review the available facts, identify missing information and prepare questions for the agent.
Investment Insights
Based on property information with market context.
The Ramsey Street property includes two parcels totaling 1.77 acres. One parcel at 1917 Ramsey encompasses 0.64 acres, while the adjacent parcel measures 1.13 acres. The 0.64-acre parcel contains two structures. One building is approximately 2300 square feet with an open-space design, an HVAC system, and two bathrooms. The second building is approximately 720 square feet with an HVAC system and a single bathroom. The commercial property is located near downtown Fayetteville, close to the VA Hospital and the MLK Freeway. The local population within a 3-mile radius is 43,240 residents. The nearby MLK Freeway provides transportation and connectivity. This property is positioned to meet community needs and capitalize on healthcare-related demand in the area.
Key Highlights
- 1.77 acres total across two parcels.
- Two buildings on the property: 2300 sq ft (with 2 bathrooms) and 720 sq ft (with 1 bathroom), both with HVAC.
- Strategically located near downtown Fayetteville, the VA Hospital, and the MLK Freeway.
Financial Insights
Estimated NOI and Cap Rate
NOI / Yr
$34,133
Cap Rate
8.03%
Suggested Prices Based on Cap Rates
Cap Rate 5%
$682,660
$682.7K
Cap Rate 7%
$487,614
$487.6K
Cap Rate 9%
$379,256
$379.3K
Market Conditions
NOI Build-Up for 3,020 SF
Gross rent
$54.4K $18.00/SF
− Vacancy
−$5.6K −$1.85/SF
EGI
$48.8K $16.15/SF
− OpEx
−$14.6K −$4.84/SF
NOI
$34.1K $11.30/SF
Area
Fayetteville, NC
Vacancy
10.30%
Lease Rate
$18.00 /SF/Yr
Expense Ratio
30.00%
Simulate Cap Rate and NOI
Suggested Prices Based on Cap Rates
Cap Rate 5%
$682,660
Cap Rate 7%
$487,614
Cap Rate 9%
$379,256
Alternative Uses
Best Use
Retail
$487.6K
$426.7K – $568.9K
NOI $34,133 @ 7.0% cap · market cap 8.03%
Second Best
—
—
no second resolved use
Theoretical Best
Office A
$661.8K
$579.1K – $772.2K
NOI $46,329 @ 7.0% cap · market cap 10.90%
Zoning and permitted uses should be independently verified with authorities.
How Realmo checks its estimates
Property Analytics
Who owns this building?
See the owner, sales and loan history
Open Analytics
Current Use
Location Intelligence
Trade Area within ½ mile
333
Businesses Nearby
Explore this area
Business Placement
Demographics for 28301, NC
17,670
Population
8,590
Households
2.1
Avg Household Size
35
Median Age
17%
College-Educated
88%
High-School Grad
12.4 sq mi
ZIP Area
1,425
Density / Sq Mi
$36,955
Median Household Income
$28,350
Median Earnings
$926
Median Rent
$109,900
Median Home Value
Check the figures for this property
Cap Rate, Value Estimation, Potential NOI and more
View Realmo Analytics
Market
Vacancy Rate% for Retail in South region



Frequently Asked Questions
What type of property is this?
Retail space - Two buildings on 1.77 acres near downtown Fayetteville.
Where is this retail space located?
The property is located at 1917 Ramsey St Fayetteville, NC.
What is the asking price?
The asking price for this property is $425,000.
What are key features of this property?
This property features: 1.77 acres total across two parcels.; Two buildings on the property: **2300 sq ft (with 2 bathrooms) and 720 sq ft (with 1 bathroom), both with HVAC.**; Strategically located near downtown Fayetteville, the VA Hospital, and the MLK Freeway.