Six-Bedroom
For Sale
$261,200
1914 N Moulton Court Oklahoma, Oklahoma City, OK 73127
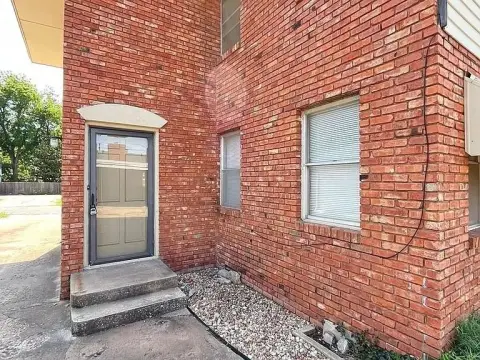
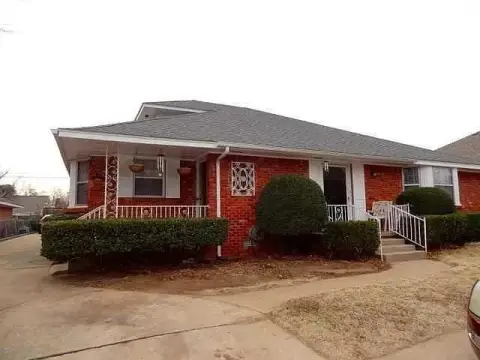
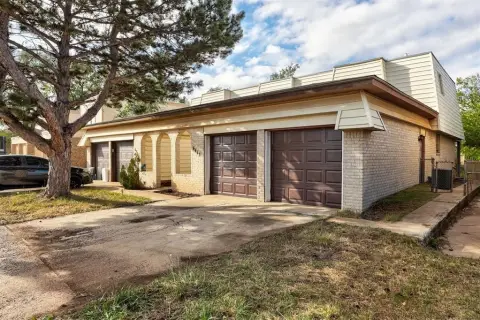
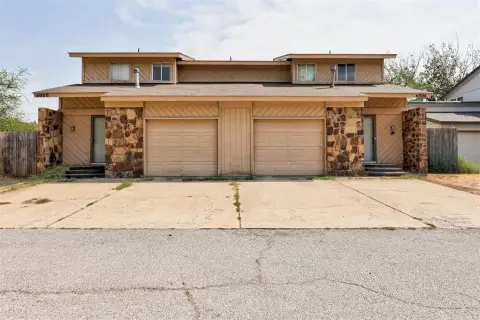
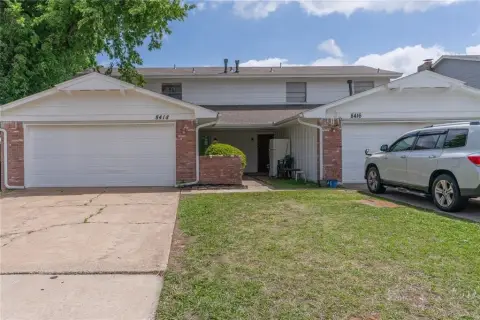
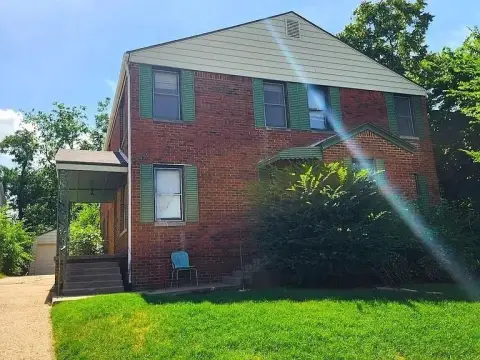
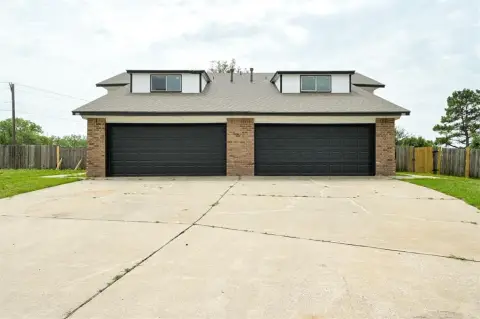
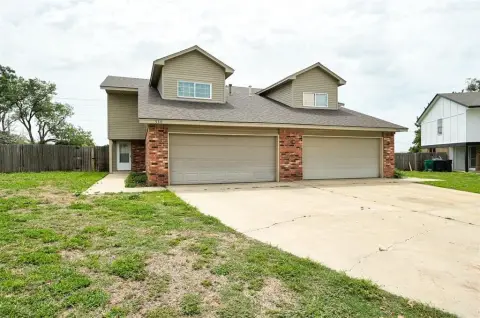
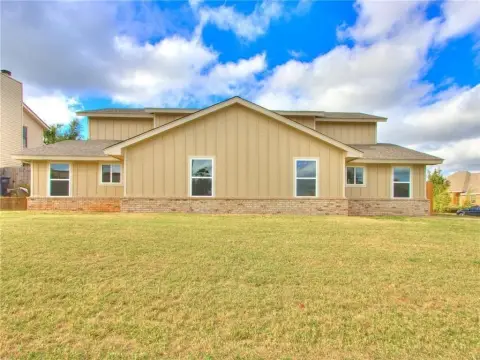
Updated townhouse-style duplex with separate living spaces, fireplaces, and central gas and electric systems.
Property Size2,672 SF
Days on Market261
Property Features for 1914 N Moulton Court Oklahoma
General Information
Standard status
Active
Size
2,672 SF
Property subtype
Duplex
Additional Details
Multifamily Units
2
Amenities
Fireplace
Central Elec
Gas
Shingle
Building Details
Building Size
2,672 SF
Year Built
1971
Listing Agency:
Modern Abode Realty
Listed By:
Jeremy Dugas · License #178327
(405) 474-4732
Source:
Kw
Added: Jan 28
Changed: Oct 15
Last Checked: Oct 14 at 10:23PM
Displayed information is deemed reliable but is not guaranteed and should be independently verified. All listing content including descriptions, pricing, images are the copyrighted material of Modern Abode Realty

Ask AI about this property
Review the available facts, identify missing information and prepare questions for the agent.
Investment Insights
Based on property information with market context.
This townhouse-style duplex offers six bedrooms and two bathrooms on each side, creating substantial residential space across both units. The property includes updates, fireplaces, central gas and central electric systems, and architectural shingle roofing. Built in 1971, the layout is configured for two distinct sides within one duplex property.
Set on a quiet cul-de-sac in northwest Oklahoma City, the property provides access to nearby shops, restaurants, and entertainment. Its two-unit design and generous bedroom count support a residential income use while retaining the character and separate living arrangement of townhouse-style homes.
Set on a quiet cul-de-sac in northwest Oklahoma City, the property provides access to nearby shops, restaurants, and entertainment. Its two-unit design and generous bedroom count support a residential income use while retaining the character and separate living arrangement of townhouse-style homes.
Key Highlights
- Six bedrooms and two bathrooms on each side
- Two‑unit townhouse‑style configuration
- Updates completed throughout the property
Financial Insights
Estimated NOI and Cap Rate
NOI / Yr
$22,570
Cap Rate
8.64%
Suggested Prices Based on Cap Rates
Cap Rate 5%
$451,400
$451.4K
Cap Rate 7%
$322,429
$322.4K
Cap Rate 9%
$250,778
$250.8K
Market Conditions
NOI Build-Up for 2,672 SF
Gross rent
$43.3K $16.20/SF
− Vacancy
−$2.3K −$0.84/SF
EGI
$41.0K $15.36/SF
− OpEx
−$18.5K −$6.91/SF
NOI
$22.6K $8.45/SF
Area
Oklahoma City, OK
Vacancy
5.20%
Lease Rate
$16.20 /SF/Yr
Expense Ratio
45.00%
Simulate Cap Rate and NOI
Suggested Prices Based on Cap Rates
Cap Rate 5%
$451,400
Cap Rate 7%
$322,429
Cap Rate 9%
$250,778
Alternative Uses
Best Use
Multifamily LT 5
$348.5K
$304.9K – $406.5K
NOI $24,392 @ 7.0% cap · market cap 9.34%
Second Best
Apartment 5plus
$322.4K
$282.1K – $376.2K
NOI $22,570 @ 7.0% cap · market cap 8.64%
Theoretical Best
Specialty Retail
$913.8K
$799.6K – $1.07M
NOI $63,968 @ 7.0% cap · market cap 24.49%
Zoning and permitted uses should be independently verified with authorities.
How Realmo checks its estimates
Property Analytics
Current Use
Lease Details
2
Residential units
Location Intelligence
Trade Area within ½ mile
467
Businesses Nearby
Explore this area
Business Placement
Demographics for 73127, OK
27,007
Population
11,329
Households
2.4
Avg Household Size
32
Median Age
16%
College-Educated
76%
High-School Grad
11.3 sq mi
ZIP Area
2,390
Density / Sq Mi
$46,020
Median Household Income
$28,766
Median Earnings
$926
Median Rent
$139,200
Median Home Value
Market
Vacancy Rate% for Multifamily in South region



Frequently Asked Questions
What type of property is this?
Duplex - Updated townhouse-style duplex with separate living spaces, fireplaces, and central gas and electric systems.
Where is this duplex located?
The property is located at 1914 N Moulton Court Oklahoma Oklahoma City, OK.
What is the asking price?
The asking price for this property is $261,200.
What are key features of this property?
This property features: Six bedrooms and two bathrooms on each side; Two‑unit townhouse‑style configuration; Updates completed throughout the property


