Duplex-Style Residential Income
For Sale
$599,000
1910 Park, Bridgeport, CT 06604
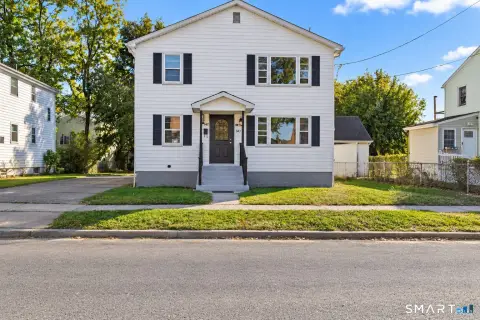
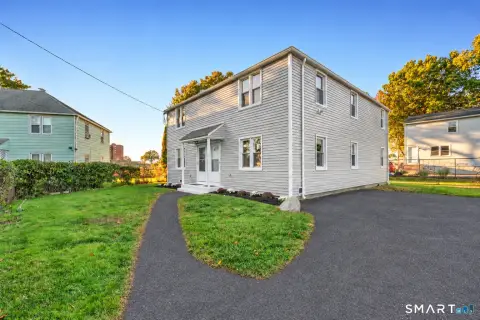
Large home configured as a two-unit option with multiple bedrooms, hardwood floors, and full baths on every level.
Property Size2,584 SF
Price / SF$231.81
Days on Market95
Property Features for 1910 Park
General Information
Standard status
Active
Size
2,584 SF
Property subtype
2 Family
Site & Location
Neighborhood
Brooklawn / St Vincents
Amenities
hardwood floors
fireplace
Building Details
Year Built
1920
Listing Agency:
Bigger & Better Realty Corp
(203) 449-8327
Listed By:
Torise Baker · License #REB.0793486
(203) 441-1812
Source:
Lockandkeyre
Added: Jul 22
Changed: Oct 23
Last Checked: Oct 23 at 8:44AM
Displayed information is deemed reliable but is not guaranteed and should be independently verified. All listing content including descriptions, pricing, images are the copyrighted material of Bigger & Better Realty Corp

Ask AI about this property
Review the available facts, identify missing information and prepare questions for the agent.
Investment Insights
Based on property information with market context.
This large residential income property offers flexible two-family potential, with a total of eight bedrooms. Interior features include hardwood floors, and a living and dining room with a fireplace. Bedroom layout includes four bedrooms on the second floor and two additional bedrooms in the finished attic, with full baths on every level.
The second unit option can be accessed via a separate entry and extends into the finished basement. That lower-level arrangement includes a kitchen, a full bath, a living room, and two bedrooms, along with storage and laundry space.
The home is being offered as-is, and will be delivered empty at closing. It is also listed separately as a single-family home under MLS 24192788.
The second unit option can be accessed via a separate entry and extends into the finished basement. That lower-level arrangement includes a kitchen, a full bath, a living room, and two bedrooms, along with storage and laundry space.
The home is being offered as-is, and will be delivered empty at closing. It is also listed separately as a single-family home under MLS 24192788.
Key Highlights
- Large home (built 1920) configured with a two‑unit option, with 8 total bedrooms
- Hardwood floors plus living and dining rooms with a fireplace
- Second‑floor layout includes 4 bedrooms, with 2 additional bedrooms in the finished attic
Financial Insights
Estimated NOI and Cap Rate
NOI / Yr
$33,486
Cap Rate
5.59%
Suggested Prices Based on Cap Rates
Cap Rate 5%
$669,720
$669.7K
Cap Rate 7%
$478,371
$478.4K
Cap Rate 9%
$372,067
$372.1K
Market Conditions
NOI Build-Up for 2,584 SF
Gross rent
$51.2K $19.80/SF
− Vacancy
−$3.3K −$1.29/SF
EGI
$47.8K $18.51/SF
− OpEx
−$14.4K −$5.55/SF
NOI
$33.5K $12.96/SF
Area
Bridgeport, CT
Vacancy
6.50%
Lease Rate
$19.80 /SF/Yr
Expense Ratio
30.00%
Simulate Cap Rate and NOI
Suggested Prices Based on Cap Rates
Cap Rate 5%
$669,720
Cap Rate 7%
$478,371
Cap Rate 9%
$372,067
Alternative Uses
Best Use
Multifamily LT 5
$478.4K
$418.6K – $558.1K
NOI $33,486 @ 7.0% cap · market cap 5.59%
Second Best
Apartment 5plus
$434.2K
$379.9K – $506.6K
NOI $30,395 @ 7.0% cap · market cap 5.07%
Theoretical Best
Office A
$737.5K
$645.3K – $860.5K
NOI $51,627 @ 7.0% cap · market cap 8.62%
Zoning and permitted uses should be independently verified with authorities.
How Realmo checks its estimates
Property Analytics
Contact the owner directly
Get the owner's phone numbers and email
Open Analytics
Location Intelligence
Trade Area within ½ mile
1,061
Businesses Nearby
Explore this area
Business Placement
Demographics for 06604, CT
30,003
Population
12,972
Households
2.3
Avg Household Size
35
Median Age
29%
College-Educated
74%
High-School Grad
3.2 sq mi
ZIP Area
9,376
Density / Sq Mi
$45,794
Median Household Income
$34,706
Median Earnings
$1,419
Median Rent
$231,300
Median Home Value
Check the figures for this property
Cap Rate, Value Estimation, Potential NOI and more
View Realmo Analytics
Market
Vacancy Rate% for Multifamily in Northeast region






Frequently Asked Questions
What type of property is this?
Duplex - Large home configured as a two-unit option with multiple bedrooms, hardwood floors, and full baths on every level.
Where is this duplex located?
The property is located at 1910 Park Bridgeport, CT.
What is the asking price?
The asking price for this property is $599,000.
What are key features of this property?
This property features: Large home (built 1920) configured with a two‑unit option, with 8 total bedrooms; Hardwood floors plus living and dining rooms with a fireplace; Second‑floor layout includes 4 bedrooms, with 2 additional bedrooms in the finished attic


