Bi-Level Duplex with Outdoor
For Sale
$650,000
Pending
1906 E YORK STREET, Philadelphia, PA 19125
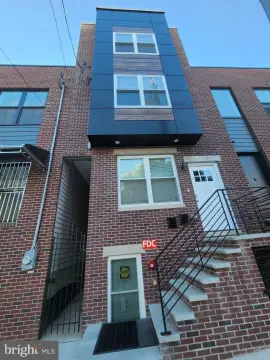
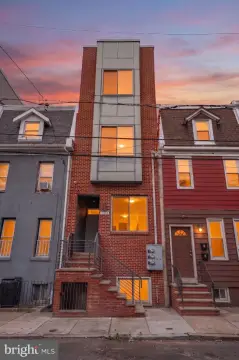
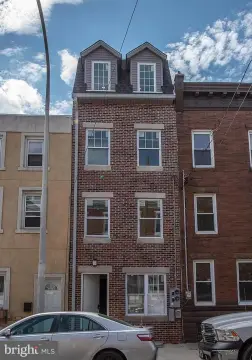
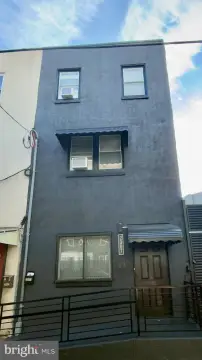
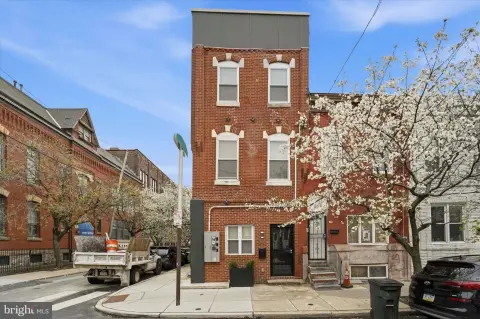
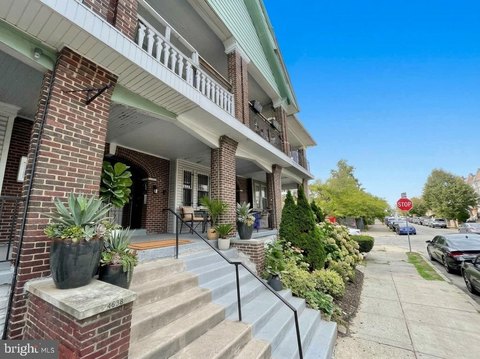
The two-unit property includes central HVAC, contemporary finishes, and several outdoor areas.
Property Size3,000 SF
Days on Market66
Property Features for 1906 E YORK STREET
General Information
Standard status
Pending
Size
3,000 SF
Property subtype
Duplex
Site & Location
Highway Access
Yes
Public Transit
Yes
Units
Unit Mix
2 x 3BR bi-level
Multifamily Units
2
Amenities
central HVAC
roof deck
balcony
patio
Building Details
Year Built
2020
Buildings
1
Listing Agency:
Keller Williams Liberty Place
(609) 399-5454
Listed By:
Ryan J McManus · License #RS316262
(610) 606-1095
Source:
Cummingsrealtors
Added: Aug 19
Changed: Oct 21
Last Checked: Oct 20 at 10:22PM
Displayed information is deemed reliable but is not guaranteed and should be independently verified. All listing content including descriptions, pricing, images are the copyrighted material of Keller Williams Liberty Place

Ask AI about this property
Review the available facts, identify missing information and prepare questions for the agent.
Investment Insights
Based on property information with market context.
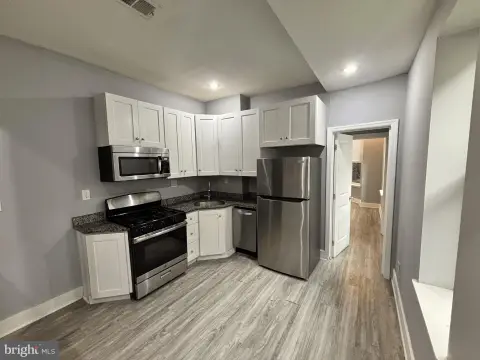
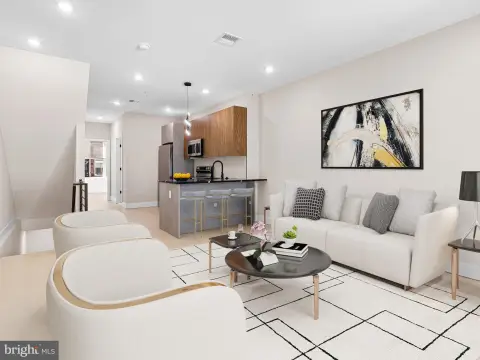
Completed in 2020, this 3,000-square-foot duplex at 1906 E York Street contains two bi-level residences, each with three bedrooms. The interiors feature contemporary finishes, central HVAC, and durable LVP flooring. Outdoor amenities include a roof deck, balcony, and patio. A 10-year tax abatement remains in place through 2030.
The property is located in Philadelphia's 19125 ZIP code, within walking distance of the Front Street and Frankford Avenue commercial corridors. SEPTA's York-Dauphin station is one block away, while I-95, I-76, and I-676 provide regional roadway access. The address is also situated near the Fishtown and Kensington neighborhoods, with restaurants, cafes, and shops nearby.
The property is located in Philadelphia's 19125 ZIP code, within walking distance of the Front Street and Frankford Avenue commercial corridors. SEPTA's York-Dauphin station is one block away, while I-95, I-76, and I-676 provide regional roadway access. The address is also situated near the Fishtown and Kensington neighborhoods, with restaurants, cafes, and shops nearby.
Key Highlights
- 3,000 SF duplex completed in 2020
- Two bi‑level 3‑bedroom units
- 10‑year tax abatement in place through 2030
Financial Insights
Estimated NOI and Cap Rate
NOI / Yr
$51,195
Cap Rate
7.88%
Suggested Prices Based on Cap Rates
Cap Rate 5%
$1,023,900
$1.0M
Cap Rate 7%
$731,357
$731.4K
Cap Rate 9%
$568,833
$568.8K
Market Conditions
NOI Build-Up for 3,000 SF
Gross rent
$77.4K $25.80/SF
− Vacancy
−$4.3K −$1.42/SF
EGI
$73.1K $24.38/SF
− OpEx
−$21.9K −$7.31/SF
NOI
$51.2K $17.06/SF
Area
Philadelphia, PA
Vacancy
5.51%
Lease Rate
$25.80 /SF/Yr
Expense Ratio
30.00%
Simulate Cap Rate and NOI
Suggested Prices Based on Cap Rates
Cap Rate 5%
$1,023,900
Cap Rate 7%
$731,357
Cap Rate 9%
$568,833
Alternative Uses
Best Use
Multifamily LT 5
$731.4K
$639.9K – $853.3K
NOI $51,195 @ 7.0% cap · market cap 7.88%
Second Best
Apartment 5plus
$674.1K
$589.9K – $786.5K
NOI $47,189 @ 7.0% cap · market cap 7.26%
Theoretical Best
—
—
same as Best Use
Zoning and permitted uses should be independently verified with authorities.
How Realmo checks its estimates
Property Analytics
Who owns this building?
See the owner, sales and loan history
Open Analytics
Lease Details
2
Residential units
Yes
Highway access
Location Intelligence
Trade Area within ½ mile
2,801
Businesses Nearby
Explore this area
Business Placement
Demographics for 19125, PA
25,325
Population
13,055
Households
1.9
Avg Household Size
34
Median Age
64%
College-Educated
94%
High-School Grad
1.4 sq mi
ZIP Area
18,089
Density / Sq Mi
$110,842
Median Household Income
$62,656
Median Earnings
$1,743
Median Rent
$373,600
Median Home Value
Check the figures for this property
Cap Rate, Value Estimation, Potential NOI and more
View Realmo Analytics
Market
Vacancy Rate% for Multifamily in Northeast region



Frequently Asked Questions
What type of property is this?
Duplex - The two-unit property includes central HVAC, contemporary finishes, and several outdoor areas.
Where is this duplex located?
The property is located at 1906 E YORK STREET Philadelphia, PA.
What is the asking price?
The asking price for this property is $650,000.
What are key features of this property?
This property features: 3,000 SF duplex completed in 2020; Two bi‑level 3‑bedroom units; 10‑year tax abatement in place through 2030


