Historic Mixed-Use
For Sale
$2,030,000
1900 Locust Street St, Louis, MO 63101
Commercial Sale, St Louis, MO
Property Size21,390 SF
Lot Size0.25 Acres
Price / SF$94.90
Days on Market51
Property Features for 1900 Locust Street St
General Information
Property type
Commercial Sale
Property subtype
Other
Subdivision
Lucas & Hunt Add
Directions
GPS
Standard status
Active
APN
0900-00-0020-0
Lot size
0.25 Acres
Amenities
elevator
dedicated HVAC
Building Details
Year built
1890
Floors in Building
3
Building materials
Brick
Listing Agency:
Manor Real Estate
(314) 647-6611
Listed By:
Ben Cherry · License #2006018085
3146476611x11
Added: Aug 24
Changed: Sep 25
Last Checked: Oct 13 at 1:06PM
MLS# 25081392
Copyright © 2026 Mid America Regional Information Systems, Inc. All rights reserved. All information provided by the listing agent/broker is deemed reliable but is not guaranteed and should be independently verified.
Investment Insights
Based on property information with market context.
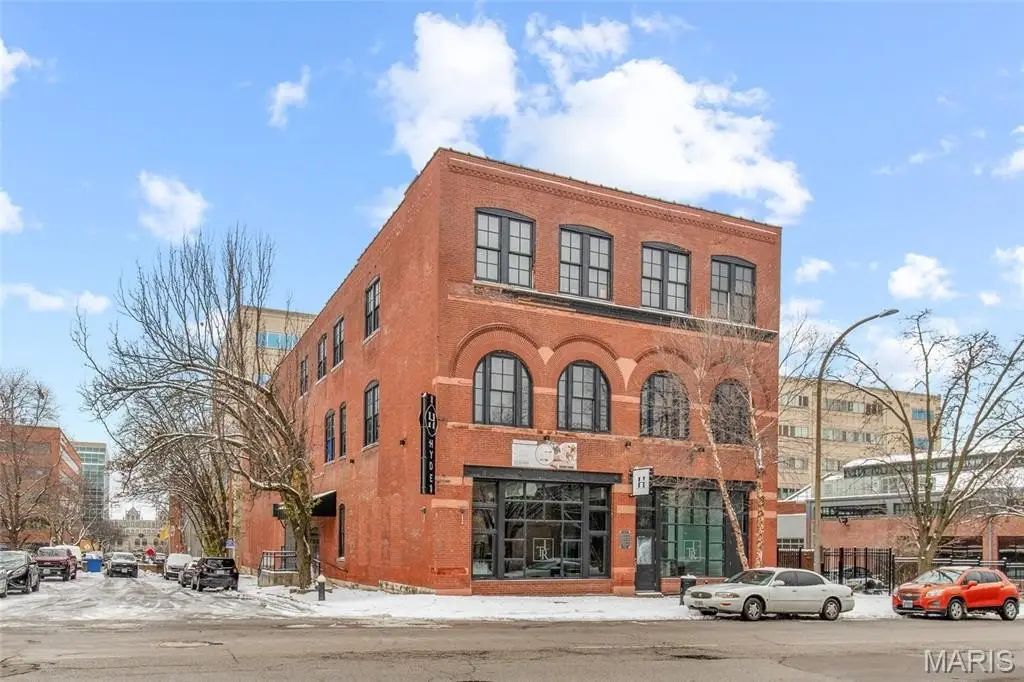
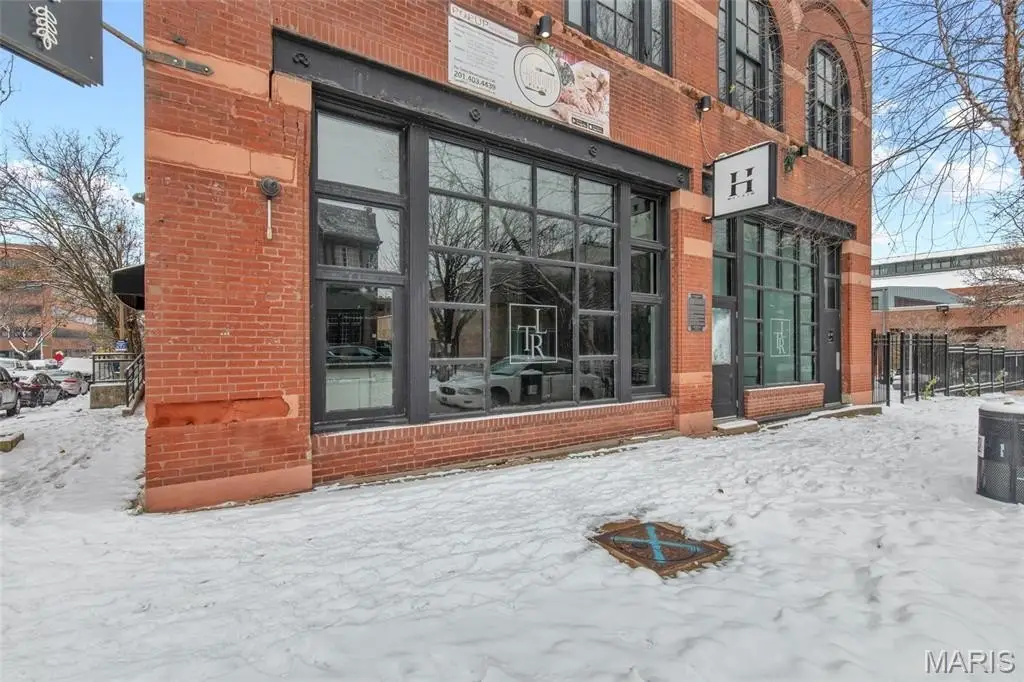
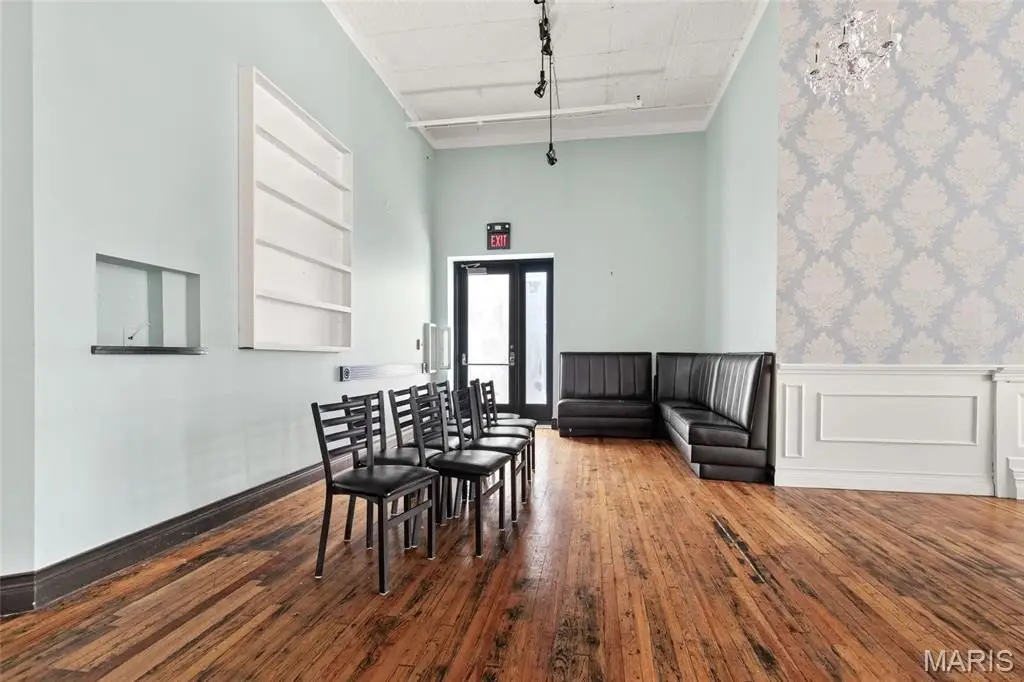
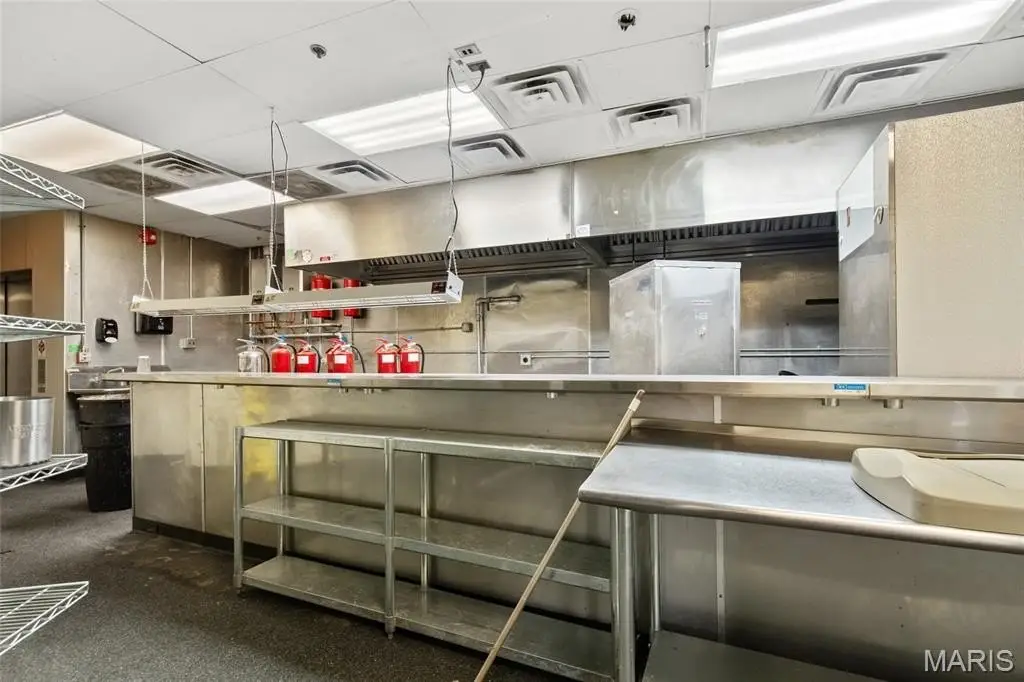
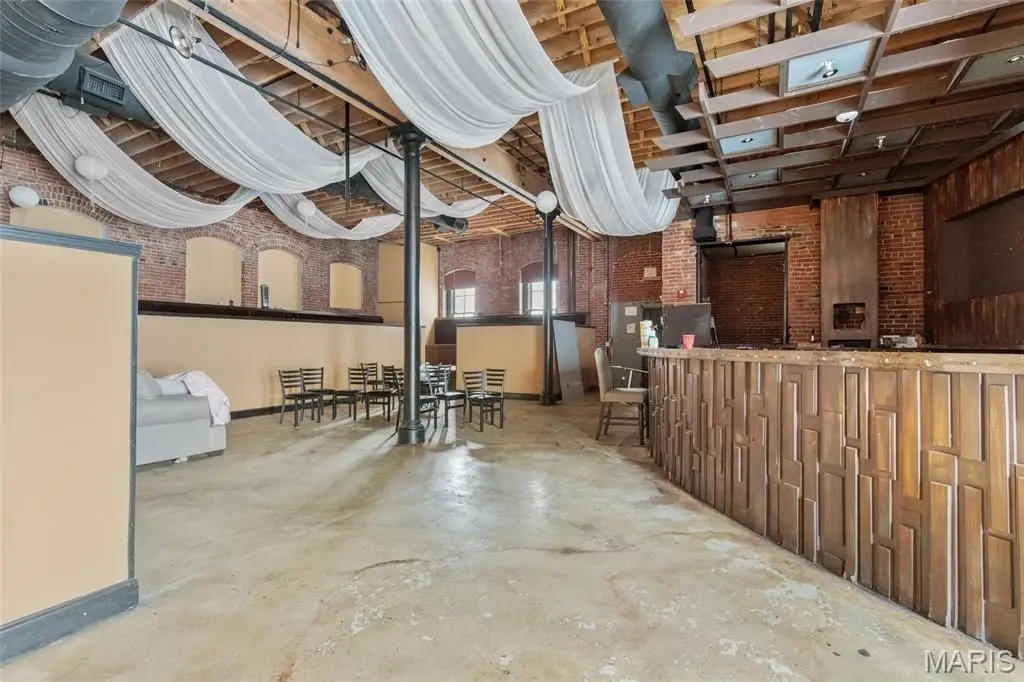
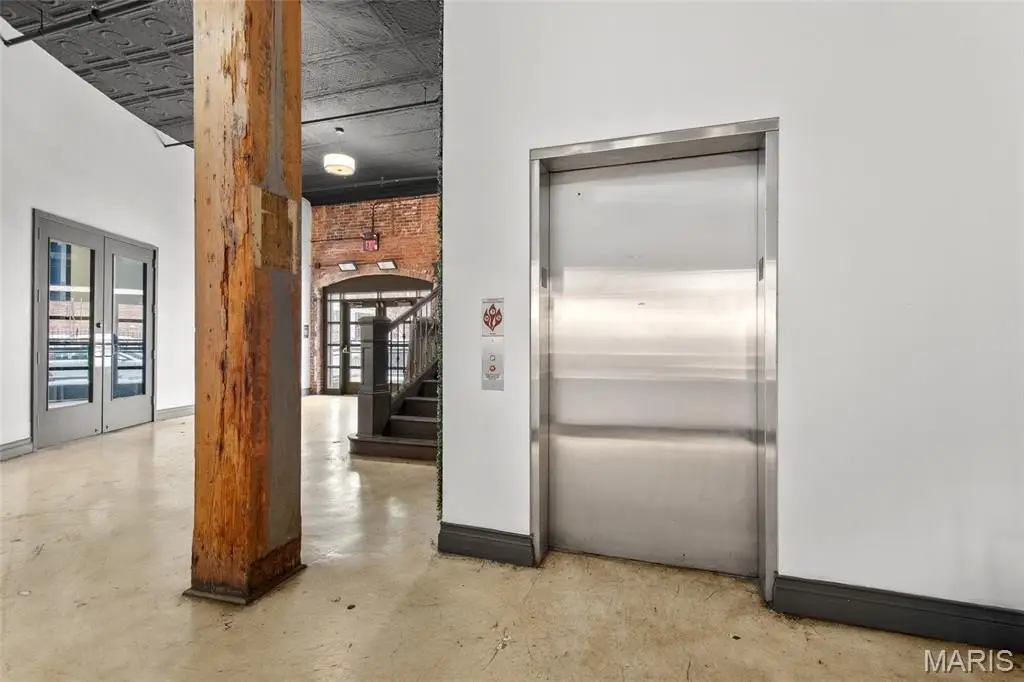
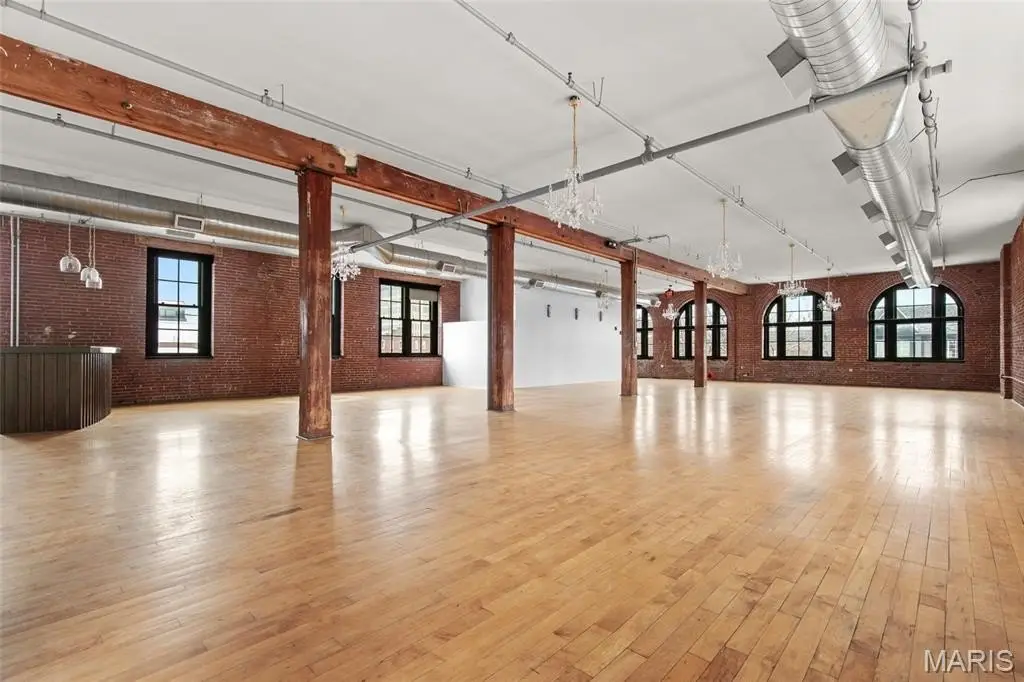
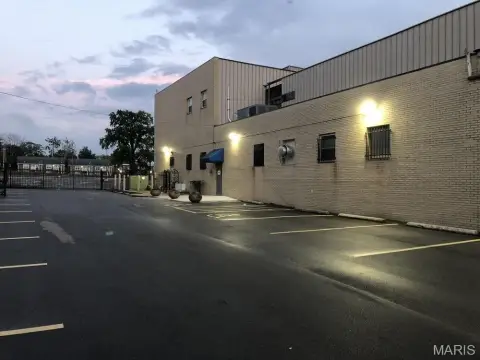
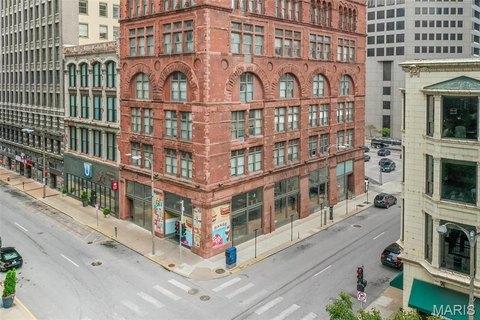
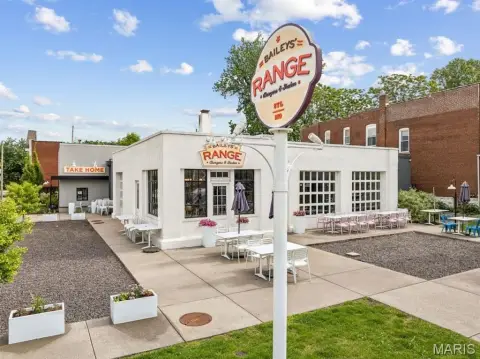
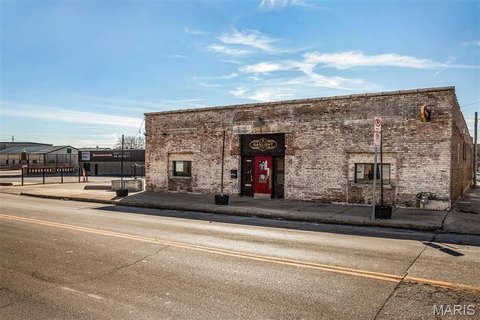
Built in 1890, this three-story brick building contains approximately 21,390 SF of mixed-use space at 1900 Locust Street in St. Louis. The property includes a 7,100+/- SF restaurant with a full kitchen and high ceilings, along with flexible event and office areas connected by an elevator. Dedicated HVAC serves each floor, supporting distinct areas within the building.
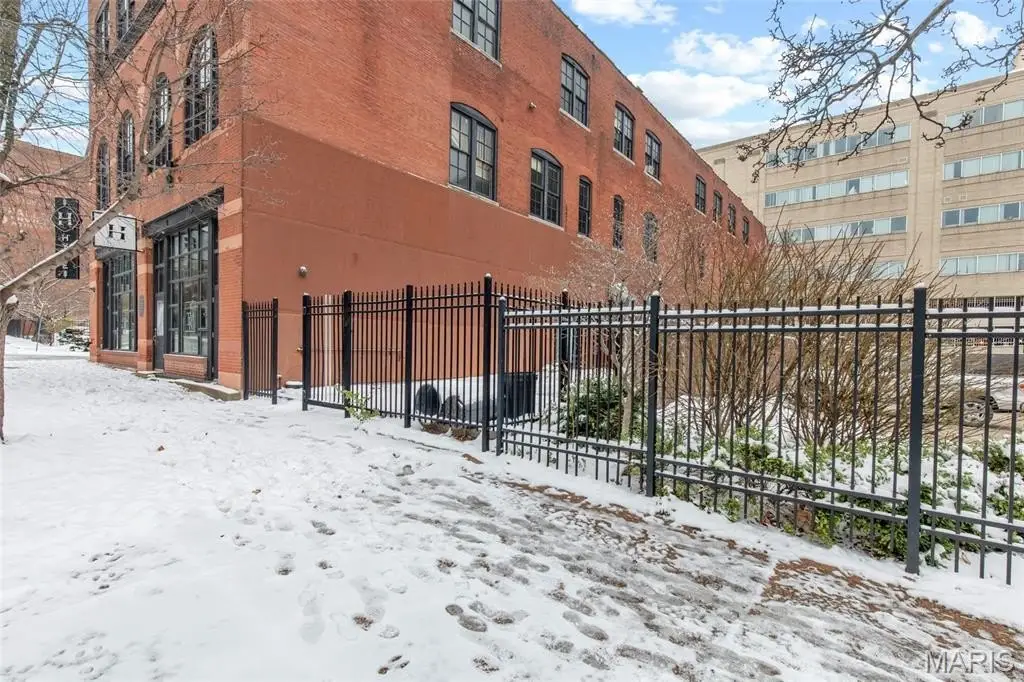
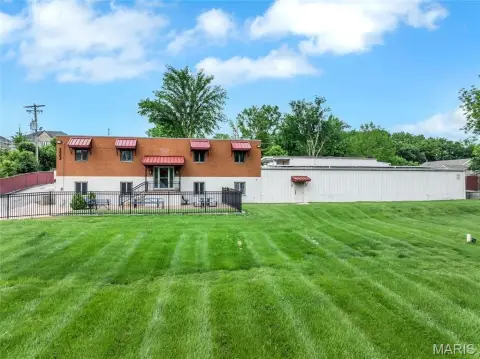
A private outdoor patio of approximately 2,600+/- SF extends the usable space. The property is located in Downtown West, steps from Union Station and the MLS Stadium, with a combination of restaurant, event, and office improvements already in place.
A private outdoor patio of approximately 2,600+/- SF extends the usable space. The property is located in Downtown West, steps from Union Station and the MLS Stadium, with a combination of restaurant, event, and office improvements already in place.
Key Highlights
- 21,390+/- SF, three‑story brick building built in 1890
- 7,100+/- SF restaurant with full kitchen and high ceilings
- Elevator‑served event and office spaces
Financial Insights
Estimated NOI and Cap Rate
NOI / Yr
$91,924
Cap Rate
4.53%
Suggested Prices Based on Cap Rates
Cap Rate 5%
$1,838,480
$1.8M
Cap Rate 7%
$1,313,200
$1.3M
Cap Rate 9%
$1,021,378
$1.0M
Market Conditions
NOI Build-Up for 21,390 SF
Gross rent
$128.3K $6.00/SF
− Vacancy
−$5.8K −$0.27/SF
EGI
$122.6K $5.73/SF
− OpEx
−$30.6K −$1.43/SF
NOI
$91.9K $4.30/SF
Area
St. Louis County, MO
Vacancy
4.50%
Lease Rate
$6.00 /SF/Yr
Expense Ratio
25.00%
Simulate Cap Rate and NOI
Suggested Prices Based on Cap Rates
Cap Rate 5%
$1,838,480
Cap Rate 7%
$1,313,200
Cap Rate 9%
$1,021,378
Alternative Uses
Best Use
Mixed Use
$3.76M
$3.29M – $4.38M
NOI $263,089 @ 7.0% cap · market cap 12.96%
Second Best
Office B
$3.73M
$3.26M – $4.35M
NOI $261,032 @ 7.0% cap · market cap 12.86%
Theoretical Best
Office A
$4.59M
$4.02M – $5.36M
NOI $321,347 @ 7.0% cap · market cap 15.83%
Zoning and permitted uses should be independently verified with authorities.
How Realmo checks its estimates
Property Analytics
Unlock full access to Insights
Subscribe to Realmo Intelligence
Open Analytics
Current Use
Location Intelligence
Trade Area within ½ mile
2,730
Businesses Nearby
Explore this area
Business Placement
Demographics for 63101, MO
4,171
Population
2,457
Households
1.7
Avg Household Size
35
Median Age
61%
College-Educated
98%
High-School Grad
0.4 sq mi
ZIP Area
10,428
Density / Sq Mi
$92,708
Median Household Income
$68,079
Median Earnings
$1,295
Median Rent
$228,300
Median Home Value
Check the figures for this property
Cap Rate, Value Estimation, Potential NOI and more
View Realmo Analytics
Market
Vacancy Rate% for Office in Midwest region

Questions? Ask Rey
Realmo’s AI knows this listing — price, zoning, demand, history. Ask anything.



Frequently Asked Questions
What type of property is this?
Mixed-use property - Three-story brick property with a built-out restaurant, elevator-served spaces, and a private outdoor patio.
Where is this mixed-use property located?
The property is located at 1900 Locust Street St Louis, MO.
What is the asking price?
The asking price for this property is $2,030,000.
What are key features of this property?
This property features: 21,390+/- SF, three‑story brick building built in 1890; 7,100+/- SF restaurant with full kitchen and high ceilings; Elevator‑served event and office spaces


