Car Wash with Office
For Sale
$899,900
1845 N 21st Street Newark, Newark, OH 43055
Existing wash equipment, office space, and ample parking support continued automotive use at this commercial property.
Property Size5,896 SF
Price / SF$152.63
Days on Market103
Property Features for 1845 N 21st Street Newark
General Information
Standard status
Active
Size
5,896 SF
Additional Details
Road Access
Yes
Taxes and HOA fees
Annual Taxes
$14,396
Amenities
office space
No
0.79
5896.0
Building Details
Building Size
5,896 SF
Year Built
1994
Stories
1
Listed By:
Brian McLaughlin
(614) 660-5959
Source:
Movenowohio
Added: Jul 5
Changed: Oct 15
Last Checked: Oct 7 at 9:27AM
Displayed information is deemed reliable but is not guaranteed and should be independently verified. All listing content including descriptions, pricing, images are the copyrighted material of Brian McLaughlin
Investment Insights
Based on property information with market context.
This 5,896-square-foot commercial property is configured as a car wash and includes the existing wash equipment. The building also provides office space, while the surrounding site offers ample parking. Built in 1994, the property can accommodate continued car wash operations or another use subject to the buyer securing any required approvals.
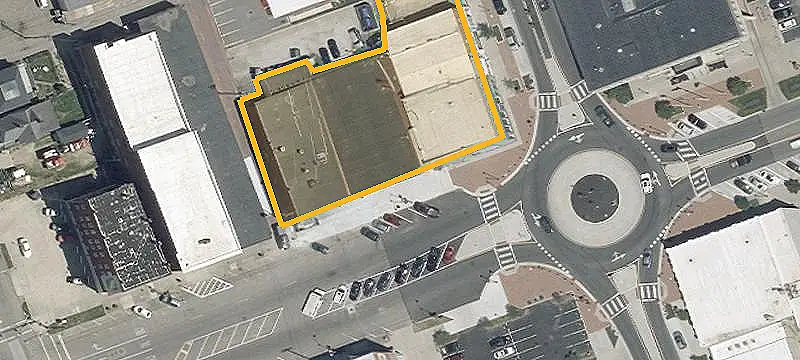
The site is positioned on a corner near State Route 13 and 1845 N 21st Street in Newark. It is also approximately 22 miles from the Intel plant being built in New Albany, providing regional context for the property.
The site is positioned on a corner near State Route 13 and 1845 N 21st Street in Newark. It is also approximately 22 miles from the Intel plant being built in New Albany, providing regional context for the property.
Key Highlights
- 5,896‑square‑foot commercial building
- Currently configured as a car wash
- Existing car wash equipment included
Financial Insights
Estimated NOI and Cap Rate
NOI / Yr
$68,505
Cap Rate
7.61%
Suggested Prices Based on Cap Rates
Cap Rate 5%
$1,370,100
$1.4M
Cap Rate 7%
$978,643
$978.6K
Cap Rate 9%
$761,167
$761.2K
Market Conditions
NOI Build-Up for 5,896 SF
Gross rent
$128.8K $21.84/SF
− Vacancy
−$30.9K −$5.24/SF
EGI
$97.9K $16.60/SF
− OpEx
−$29.4K −$4.98/SF
NOI
$68.5K $11.62/SF
Area
Licking County, OH
Vacancy
24.00%
Lease Rate
$21.84 /SF/Yr
Expense Ratio
30.00%
Simulate Cap Rate and NOI
Suggested Prices Based on Cap Rates
Cap Rate 5%
$1,370,100
Cap Rate 7%
$978,643
Cap Rate 9%
$761,167
Alternative Uses
Best Use
Retail
$1.53M
$1.34M – $1.79M
NOI $107,445 @ 7.0% cap · market cap 11.94%
Second Best
Industrial
$978.6K
$856.3K – $1.14M
NOI $68,505 @ 7.0% cap · market cap 7.61%
Theoretical Best
Flex RnD
$4.74M
$4.14M – $5.52M
NOI $331,464 @ 7.0% cap · market cap 36.83%
Zoning and permitted uses should be independently verified with authorities.
How Realmo checks its estimates
Property Analytics
Unlock full access to Insights
Subscribe to Realmo Intelligence
Open Analytics
Current Use
Lease Details
Yes
Paved road access
Location Intelligence
Trade Area within ½ mile
137
Businesses Nearby
Explore this area
Business Placement
Demographics for 43055, OH
62,590
Population
27,046
Households
2.3
Avg Household Size
40
Median Age
23%
College-Educated
92%
High-School Grad
112.7 sq mi
ZIP Area
555
Density / Sq Mi
$61,807
Median Household Income
$39,412
Median Earnings
$920
Median Rent
$185,300
Median Home Value
Check the figures for this property
Cap Rate, Value Estimation, Potential NOI and more
View Realmo Analytics
Market
Vacancy Rate% for Retail in Midwest region

Questions? Ask Rey
Realmo’s AI knows this listing — price, zoning, demand, history. Ask anything.


Frequently Asked Questions
What type of property is this?
Car wash - Existing wash equipment, office space, and ample parking support continued automotive use at this commercial property.
Where is this car wash located?
The property is located at 1845 N 21st Street Newark Newark, OH.
What is the asking price?
The asking price for this property is $899,900.
What are key features of this property?
This property features: 5,896‑square‑foot commercial building; Currently configured as a car wash; Existing car wash equipment included