Four-Unit Quadplex Income
For Sale
$699,000
1820 International Blvd, Oakland, CA 94606
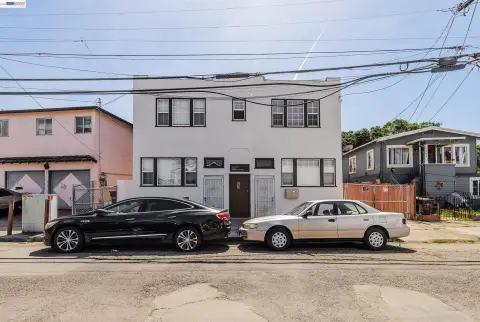
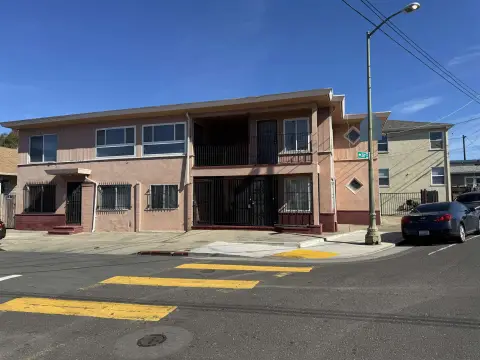
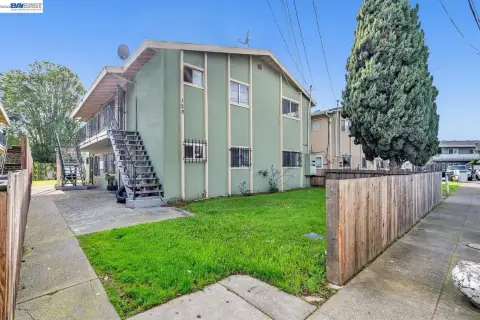
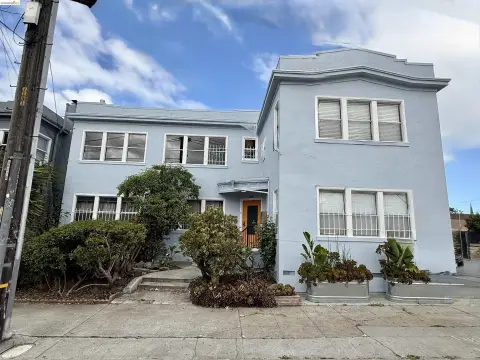
Fully occupied four-unit quadplex with separate PG&E meters and in-unit laundry in the largest unit.
Property Size2,147 SF
Price / SF$325.57
Days on Market105
Property Features for 1820 International Blvd
General Information
Standard status
Active
Size
2,147 SF
Property subtype
Multi Family
Occupancy
100%
Additional Details
Business Included
Yes
Multifamily Units
4
Building Details
Year Built
1901
Tenancy
Multi
Listing Agency:
Corcoran Icon Properties
(510) 428-0900
Listed By:
Claire Anderson · License #01513554
(510) 435-7822
Source:
Exitrealty
Added: Jul 4
Changed: Oct 15
Last Checked: Oct 14 at 7:48PM
Displayed information is deemed reliable but is not guaranteed and should be independently verified. All listing content including descriptions, pricing, images are the copyrighted material of Corcoran Icon Properties

Ask AI about this property
Review the available facts, identify missing information and prepare questions for the agent.
Investment Insights
Based on property information with market context.
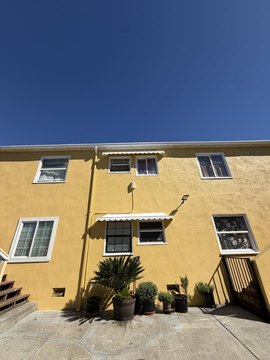
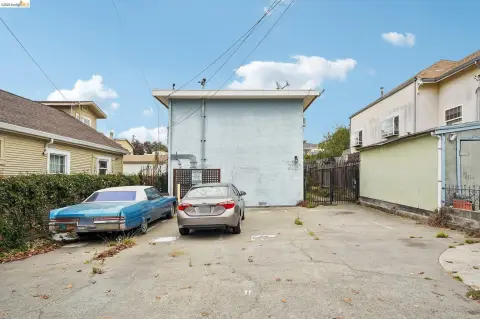
This quadplex consists of four tenant-occupied units and is presented as fully occupied, generating rental income. Unit layouts include separate PG&E meters, and the largest unit features a spacious layout with a full bath, a large attic, and in-unit washer and dryer. The property is described as well maintained, with recent owner improvements that include sewer lateral compliance, sidewalk work, and additional property updates.
The property is located at 1820 International Blvd in Oakland, CA. The listing notes accessibility to major transportation corridors and everyday amenities, including shopping and restaurants. Mobility and access are supported by walkScore of 66 (Somewhat Walkable), transitScore of 55 (Good Transit), and bikeScore of 44 (Somewhat Bikeable).
For investors or owner-operators seeking a residential income property with unit-level utility metering, this four-unit configuration can offer straightforward management across multiple rented spaces. The reported recent improvements—particularly sewer lateral compliance and exterior work—are intended to provide additional confidence for the next owner. Because the property is marketed as fully occupied, prospective buyers should review current lease terms and unit details during due diligence and confirm all operating and maintenance considerations.
The property is located at 1820 International Blvd in Oakland, CA. The listing notes accessibility to major transportation corridors and everyday amenities, including shopping and restaurants. Mobility and access are supported by walkScore of 66 (Somewhat Walkable), transitScore of 55 (Good Transit), and bikeScore of 44 (Somewhat Bikeable).
For investors or owner-operators seeking a residential income property with unit-level utility metering, this four-unit configuration can offer straightforward management across multiple rented spaces. The reported recent improvements—particularly sewer lateral compliance and exterior work—are intended to provide additional confidence for the next owner. Because the property is marketed as fully occupied, prospective buyers should review current lease terms and unit details during due diligence and confirm all operating and maintenance considerations.
Key Highlights
- Fully occupied four‑unit quadplex income property
- Four tenant‑occupied units with a desirable mix of floor plans
- Separate PG&E meters
Financial Insights
Estimated NOI and Cap Rate
NOI / Yr
$46,152
Cap Rate
6.60%
Suggested Prices Based on Cap Rates
Cap Rate 5%
$923,040
$923.0K
Cap Rate 7%
$659,314
$659.3K
Cap Rate 9%
$512,800
$512.8K
Market Conditions
NOI Build-Up for 2,147 SF
Gross rent
$69.6K $32.40/SF
− Vacancy
−$3.6K −$1.69/SF
EGI
$65.9K $30.71/SF
− OpEx
−$19.8K −$9.21/SF
NOI
$46.2K $21.50/SF
Area
ZIP 94606
Vacancy
5.22%
Lease Rate
$32.40 /SF/Yr
Expense Ratio
30.00%
Simulate Cap Rate and NOI
Suggested Prices Based on Cap Rates
Cap Rate 5%
$923,040
Cap Rate 7%
$659,314
Cap Rate 9%
$512,800
Alternative Uses
Best Use
Multifamily LT 5
$659.3K
$576.9K – $769.2K
NOI $46,152 @ 7.0% cap · market cap 6.60%
Second Best
Apartment 5plus
$602.6K
$527.3K – $703.0K
NOI $42,181 @ 7.0% cap · market cap 6.03%
Theoretical Best
Office A
$978.0K
$855.8K – $1.14M
NOI $68,462 @ 7.0% cap · market cap 9.79%
Zoning and permitted uses should be independently verified with authorities.
How Realmo checks its estimates
Property Analytics
Unlock full access to Insights
Subscribe to Realmo Intelligence
Open Analytics
Current Use
Lease Details
4
Residential units
100%
Occupancy
Multi-tenant
Tenancy
Turnkey business
Opportunity
Location Intelligence
Trade Area within ½ mile
1,665
Businesses Nearby
Explore this area
Business Placement
Demographics for 94606, CA
40,768
Population
17,457
Households
2.3
Avg Household Size
37
Median Age
40%
College-Educated
80%
High-School Grad
2.3 sq mi
ZIP Area
17,725
Density / Sq Mi
$70,769
Median Household Income
$47,558
Median Earnings
$1,775
Median Rent
$747,600
Median Home Value
Check the figures for this property
Cap Rate, Value Estimation, Potential NOI and more
View Realmo Analytics
Market
Vacancy Rate% for Multifamily in West region




Frequently Asked Questions
What type of property is this?
Quadplex - Fully occupied four-unit quadplex with separate PG&E meters and in-unit laundry in the largest unit.
Where is this quadplex located?
The property is located at 1820 International Blvd Oakland, CA.
What is the asking price?
The asking price for this property is $699,000.
What are key features of this property?
This property features: Fully occupied four‑unit quadplex income property; Four tenant‑occupied units with a desirable mix of floor plans; Separate PG&E meters


