12-Unit Apartment
For Sale
Contact for pricing
1801 MAIN ST, Lubbock, TX 79401
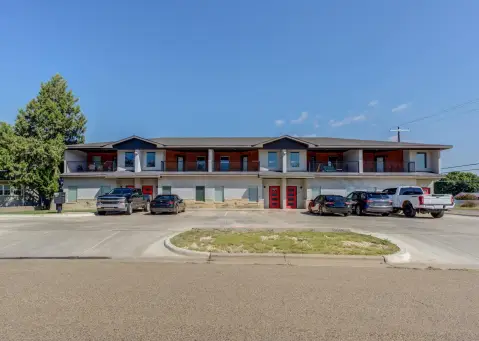
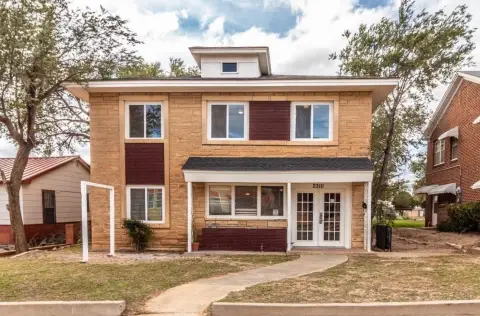
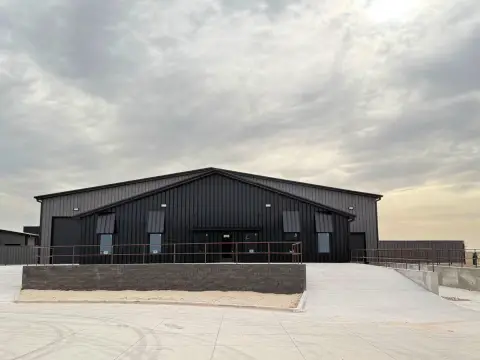
Built in 2023, the property combines leased residences with a shared fitness and yoga amenity near Texas Tech University.
Property Size9,680 SF
Price / SF$246.90
Days on Market66
Property Features for 1801 MAIN ST
General Information
Standard status
Active
Size
9,680 SF
Class
A
Total Parking Spaces
21
Property subtype
Multifamily
Occupancy
100%
Investment Type
Value Add
Net Operating Income
$63,977
Additional Details
Asking Price
$2,390,000
Utilities to Site
Yes
Multifamily Units
11
Amenities
communal fitness and yoga center
Building Details
Year Built
2023
Buildings
2
Units
11
Tenancy
Multi
Listing Agency:
Fairway Commercial Advisors
Listed By:
Smith McLelland · License #721545
(806) 559-6498
Source:
Crexi
Added: Aug 12
Changed: Oct 6
Last Checked: Oct 16 at 6:40AM
Displayed information is deemed reliable but is not guaranteed and should be independently verified. All listing content including descriptions, pricing, images are the copyrighted material of Fairway Commercial Advisors

Ask AI about this property
Review the available facts, identify missing information and prepare questions for the agent.
Investment Insights
Based on property information with market context.
This 9,680-square-foot apartment property was completed in 2023 and contains 12 total units. Eleven units are residential apartments, with all 11 currently leased. The remaining unit is configured as a communal fitness and yoga center, providing an on-site amenity for residents.
Located at 1801 Main Street in Lubbock, the property is near Texas Tech University and downtown Lubbock. Each building is served by one electric meter rather than separate meters for individual apartments. Individual metering or submetering could be evaluated as part of future utility management, subject to further review.
Located at 1801 Main Street in Lubbock, the property is near Texas Tech University and downtown Lubbock. Each building is served by one electric meter rather than separate meters for individual apartments. Individual metering or submetering could be evaluated as part of future utility management, subject to further review.
Key Highlights
- 12 total units, including 11 residential apartments and one communal fitness and yoga center
- All 11 residential units are currently 100% leased
- 9,680 SF property completed in 2023
Financial Insights
Estimated NOI and Cap Rate
NOI / Yr
$78,504
Cap Rate
3.28%
Suggested Prices Based on Cap Rates
Cap Rate 5%
$1,570,080
$1.6M
Cap Rate 7%
$1,121,486
$1.1M
Cap Rate 9%
$872,267
$872.3K
Market Conditions
NOI Build-Up for 9,680 SF
Gross rent
$152.2K $15.72/SF
− Vacancy
−$9.4K −$0.97/SF
EGI
$142.7K $14.75/SF
− OpEx
−$64.2K −$6.64/SF
NOI
$78.5K $8.11/SF
Area
Lubbock, TX
Vacancy
6.20%
Lease Rate
$15.72 /SF/Yr
Expense Ratio
45.00%
Simulate Cap Rate and NOI
Suggested Prices Based on Cap Rates
Cap Rate 5%
$1,570,080
Cap Rate 7%
$1,121,486
Cap Rate 9%
$872,267
Alternative Uses
Best Use
Apartment 5plus
$1.12M
$981.3K – $1.31M
NOI $78,504 @ 7.0% cap · market cap 3.28%
Second Best
—
—
no second resolved use
Theoretical Best
Office A
$2.44M
$2.14M – $2.85M
NOI $170,825 @ 7.0% cap · market cap 7.15%
Zoning and permitted uses should be independently verified with authorities.
How Realmo checks its estimates
Property Analytics
Unlock full access to Insights
Subscribe to Realmo Intelligence
Open Analytics
Current Use
Lease Details
11
Residential units
Yes
Utilities to site
Location Intelligence
Trade Area within ½ mile
1,565
Businesses Nearby
Explore this area
Business Placement
Demographics for 79401, TX
8,775
Population
4,813
Households
1.8
Avg Household Size
26
Median Age
26%
College-Educated
85%
High-School Grad
2.5 sq mi
ZIP Area
3,510
Density / Sq Mi
$27,255
Median Household Income
$20,570
Median Earnings
$1,048
Median Rent
$101,500
Median Home Value
Check the figures for this property
Cap Rate, Value Estimation, Potential NOI and more
View Realmo Analytics
Market
Vacancy Rate% for Multifamily in South region





Frequently Asked Questions
What type of property is this?
Apartment building - Built in 2023, the property combines leased residences with a shared fitness and yoga amenity near Texas Tech University.
Where is this apartment building located?
The property is located at 1801 MAIN ST Lubbock, TX.
What is the asking price?
The asking price for this property is $2,390,000.
What are key features of this property?
This property features: 12 total units, including 11 residential apartments and one communal fitness and yoga center; All 11 residential units are currently 100% leased; 9,680 SF property completed in 2023


