New Construction
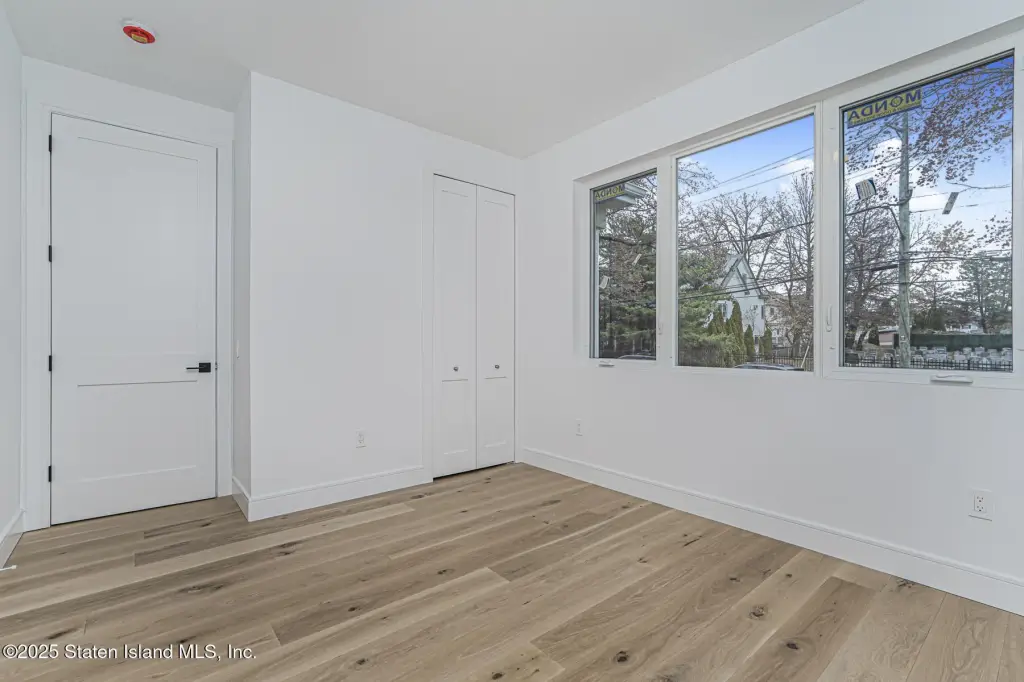
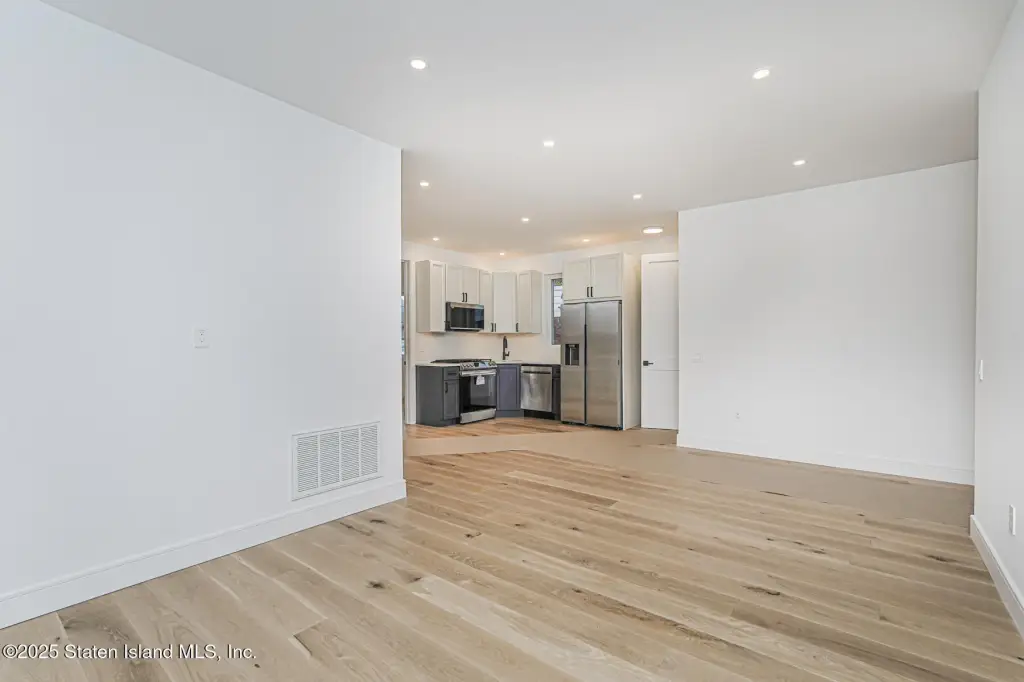
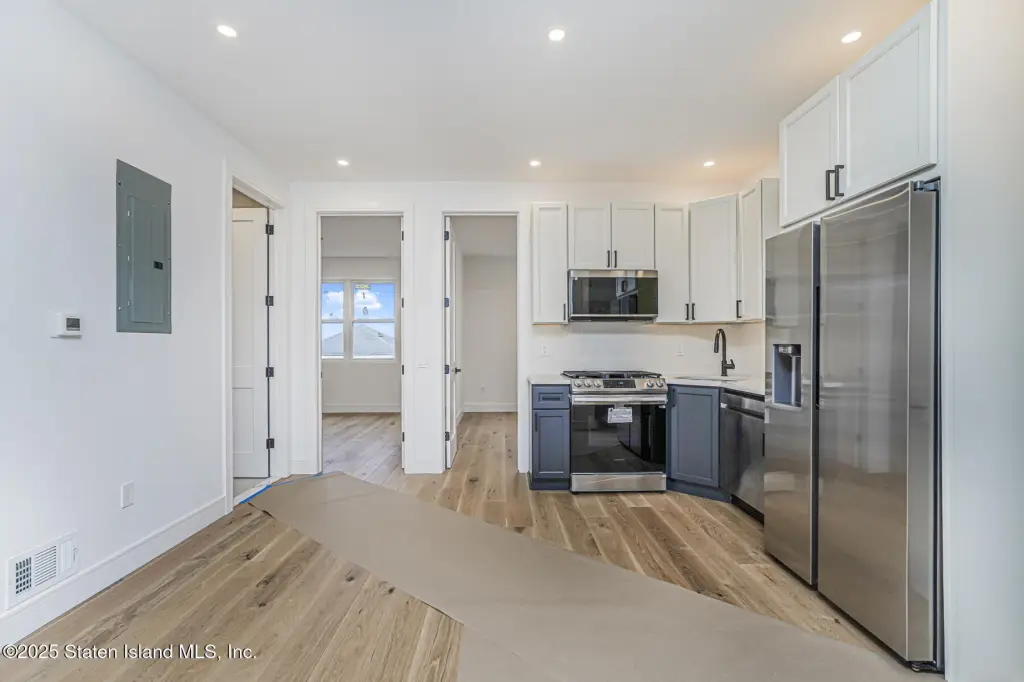
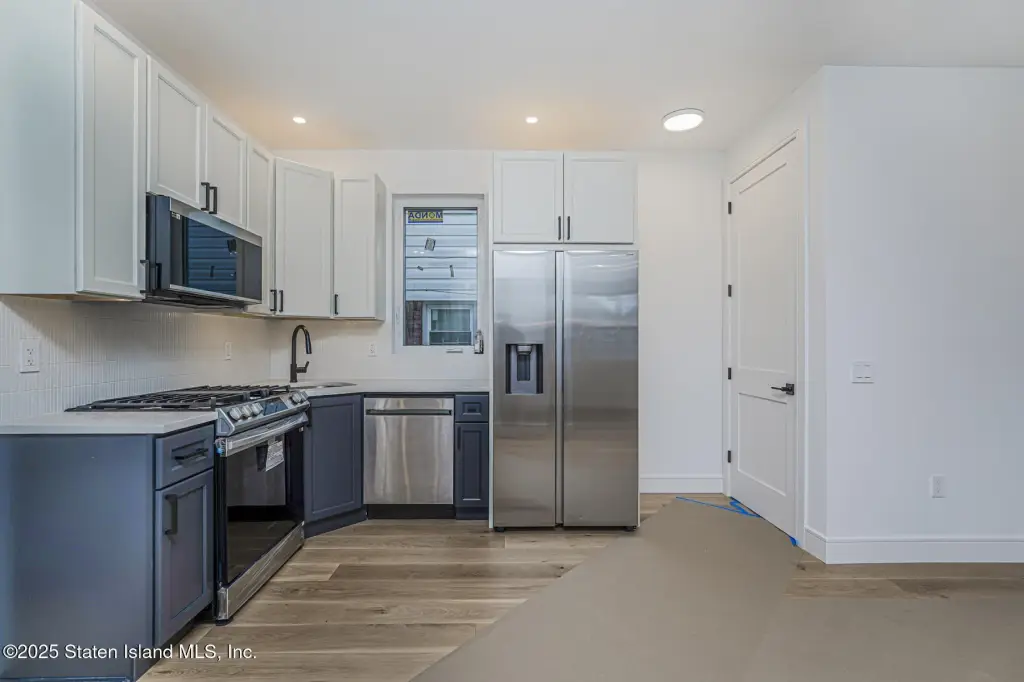
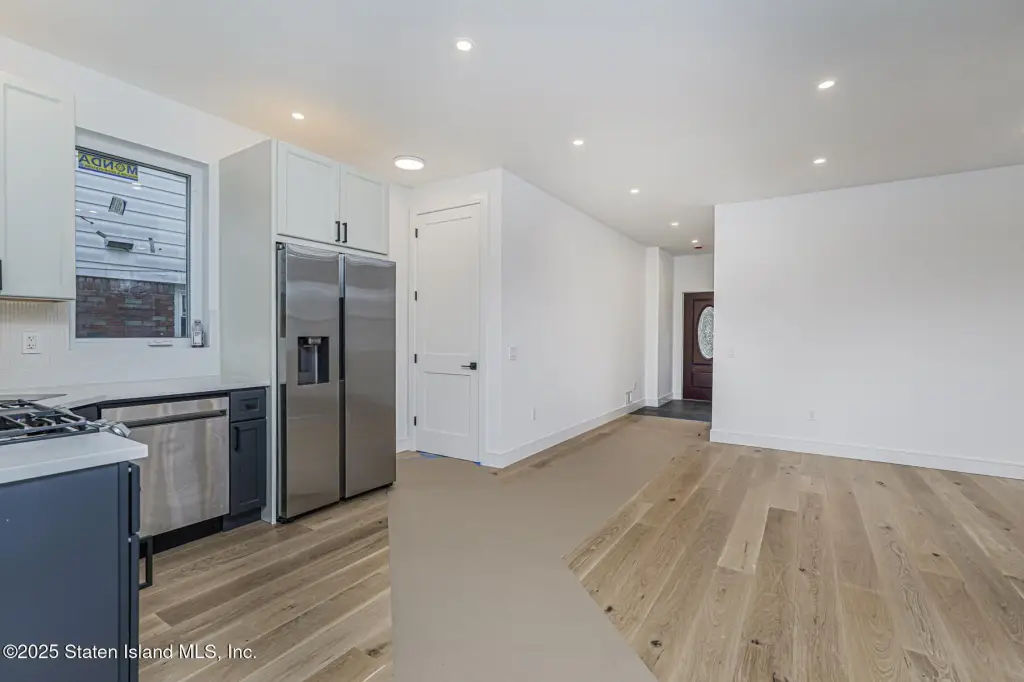
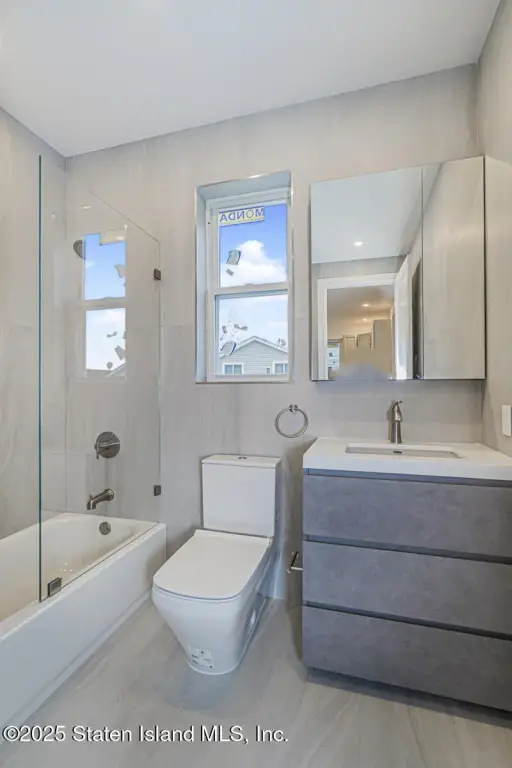
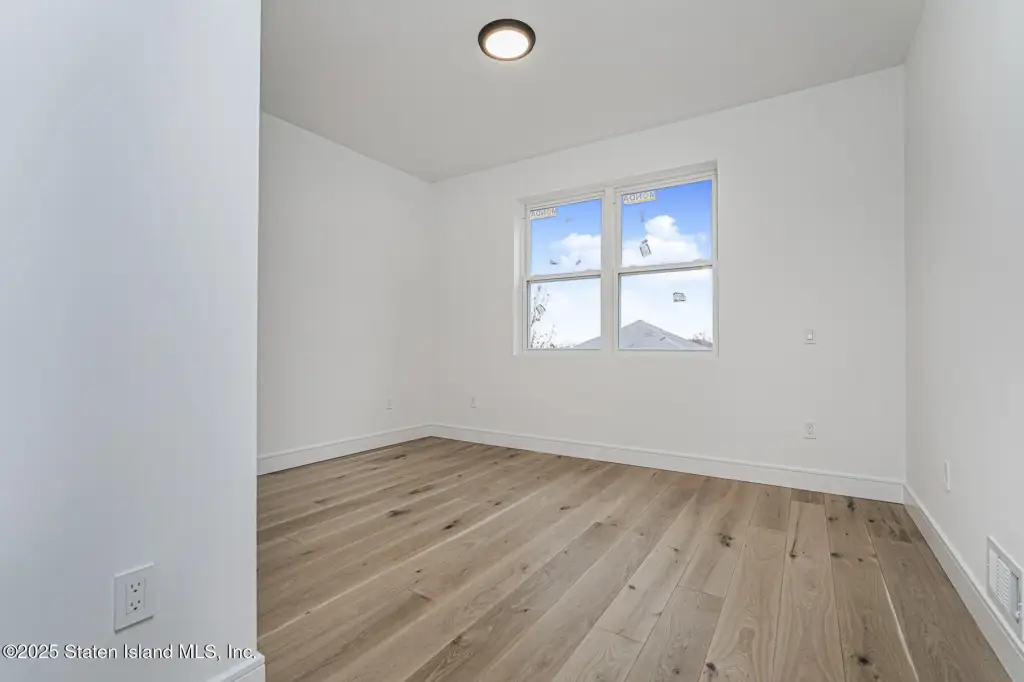
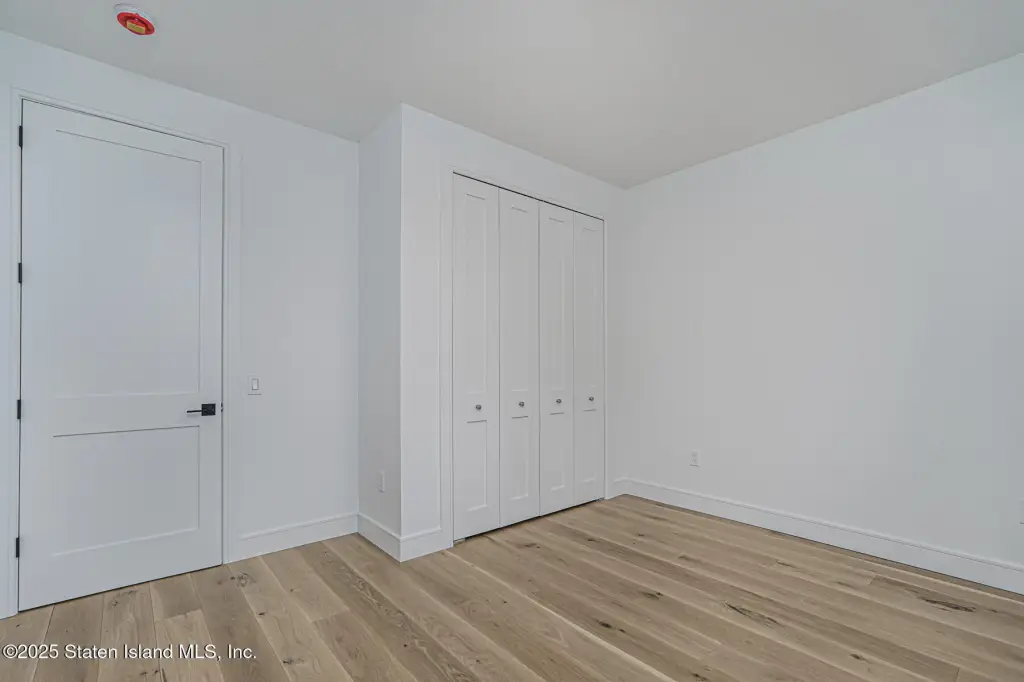
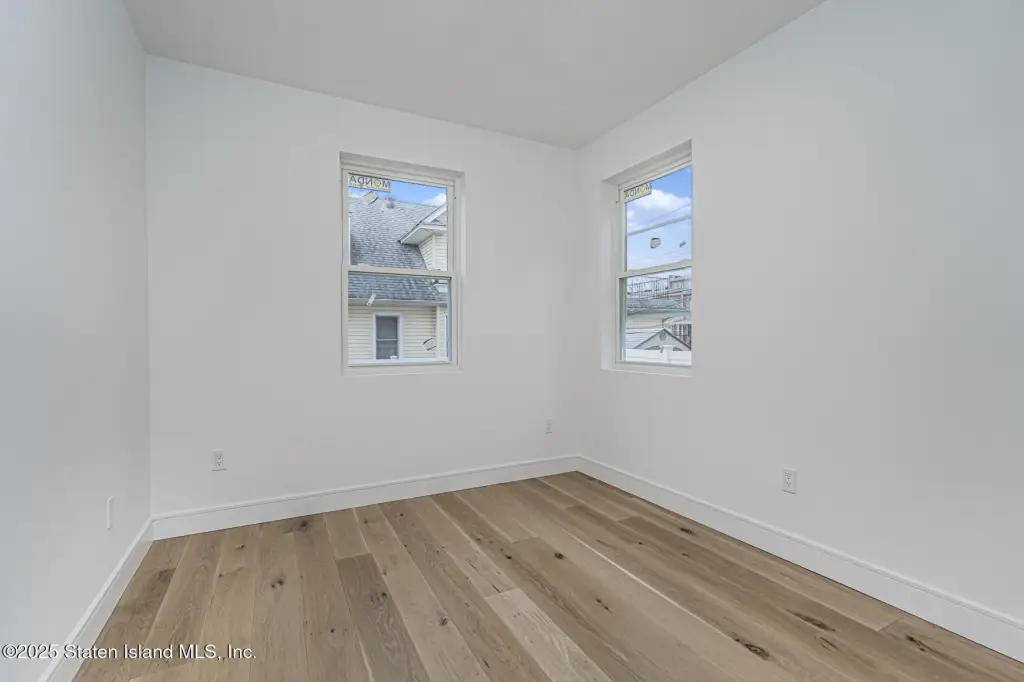
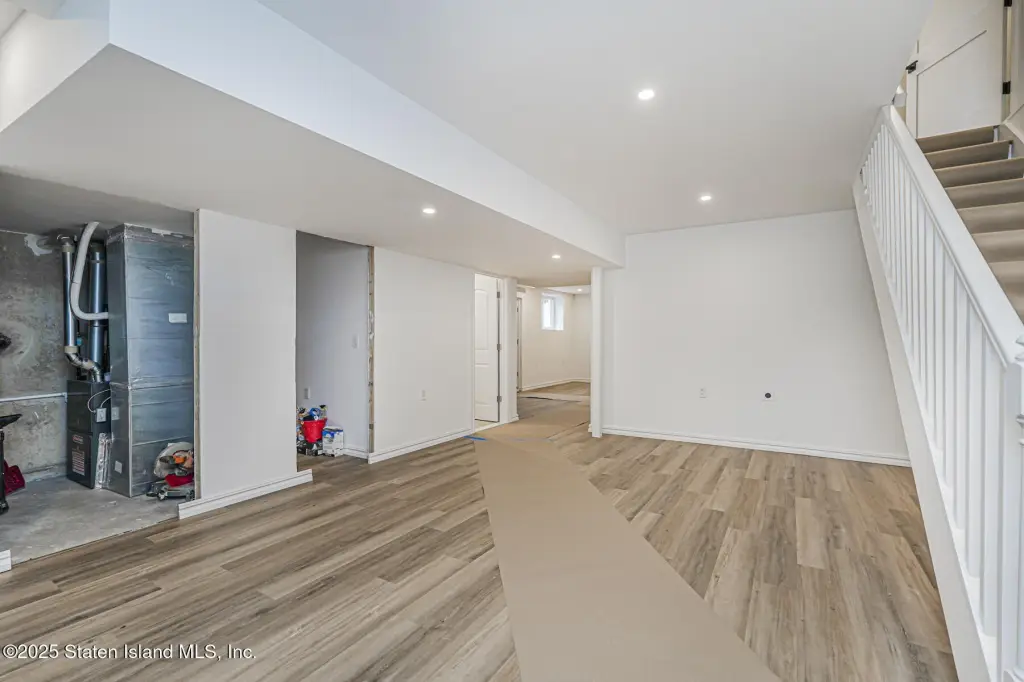
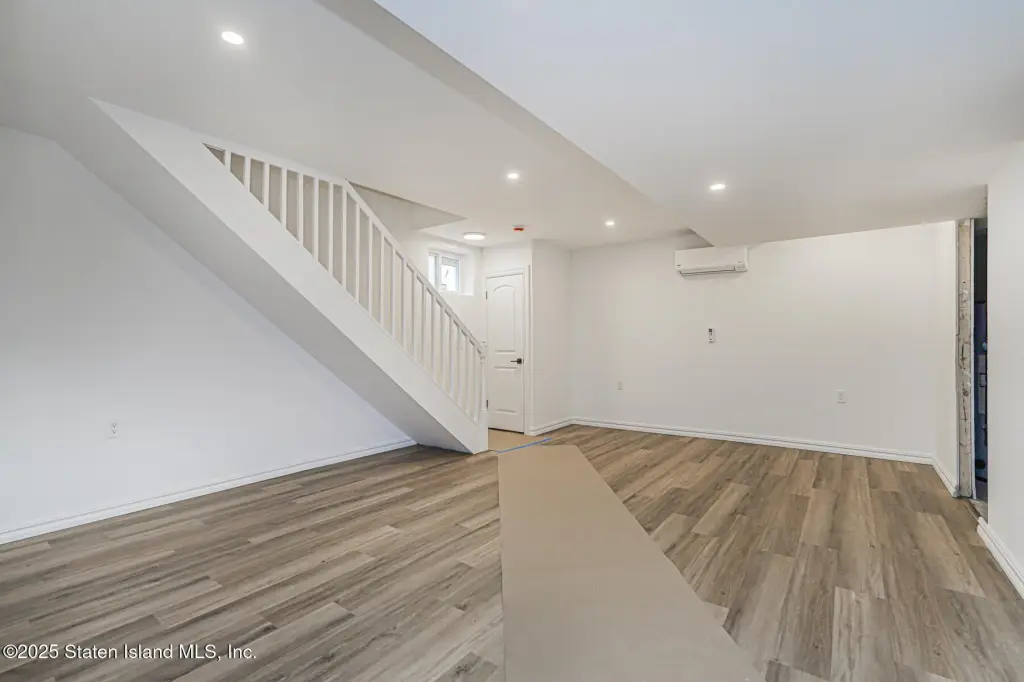
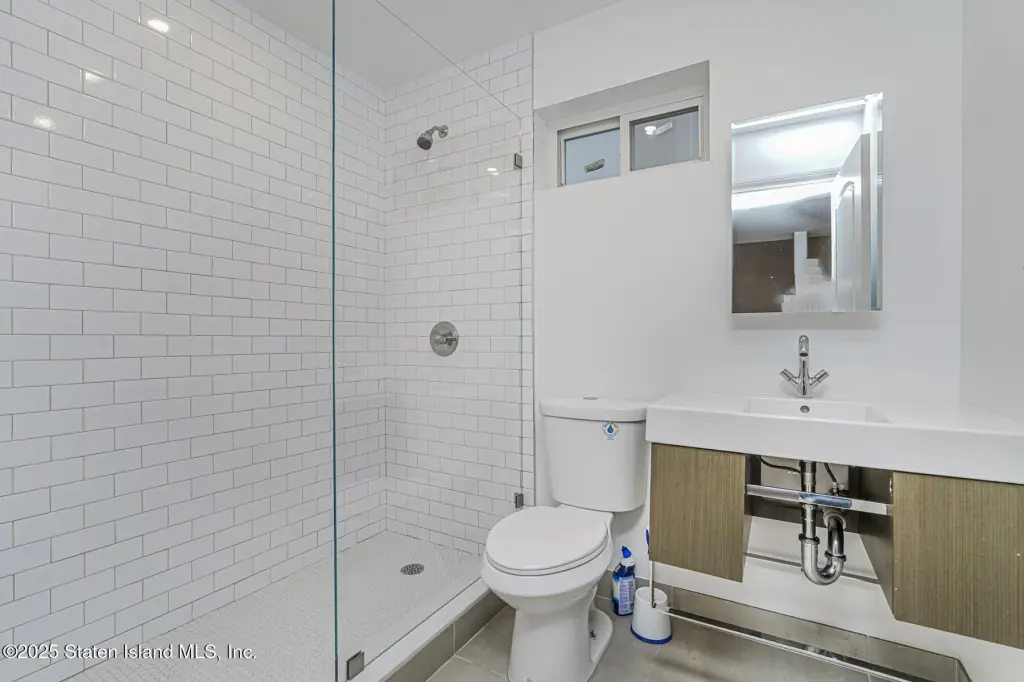
For Sale
$1,359,000
178 Parkinson Avenue, Staten Island, NY 10305
Residential Income, Staten Island, NY
Property Size3,200 SF
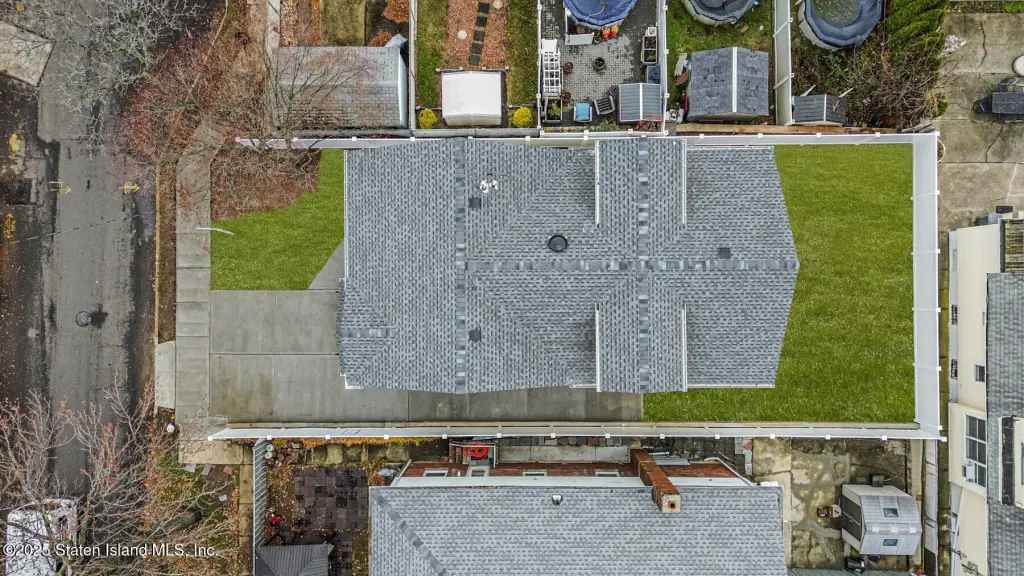
Lot Size0.09 Acres
Price / SF$424.69
Days on Market162
Property Features for 178 Parkinson Avenue
General Information
Property type
Residential Multi Family
Property subtype
Duplex
Property condition
Under Construction
Zoning
R3-2
Bedrooms
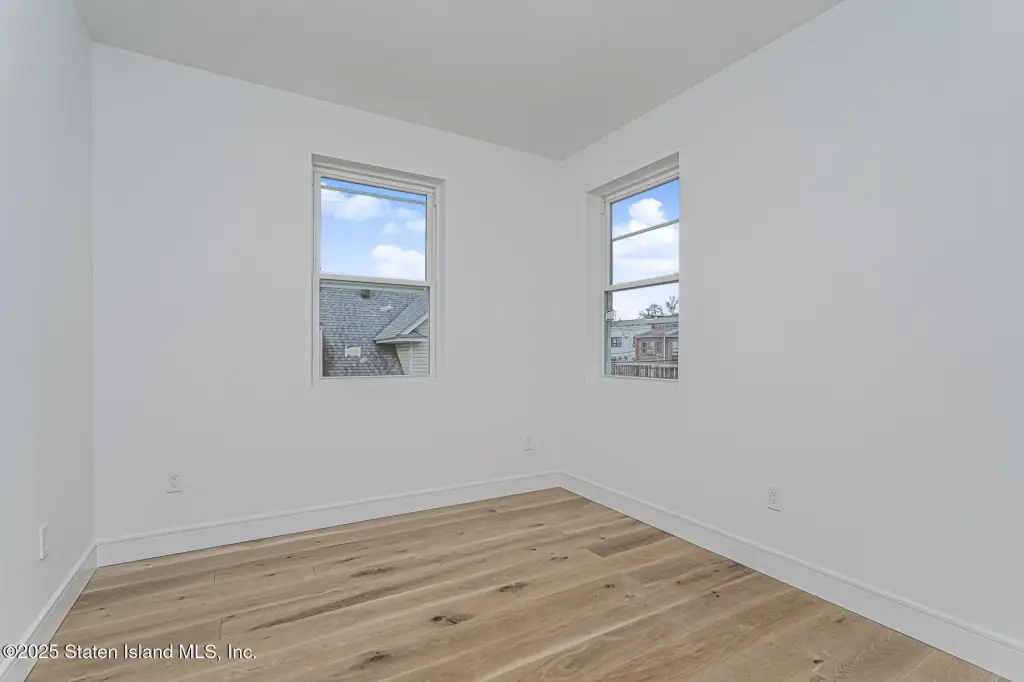
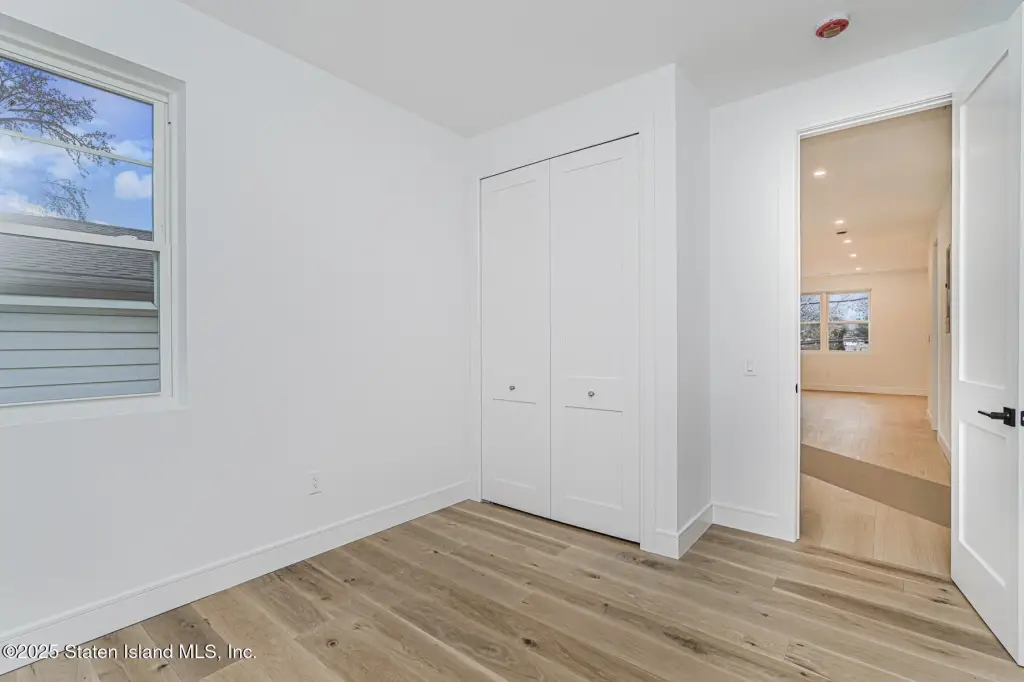
6
Bathrooms
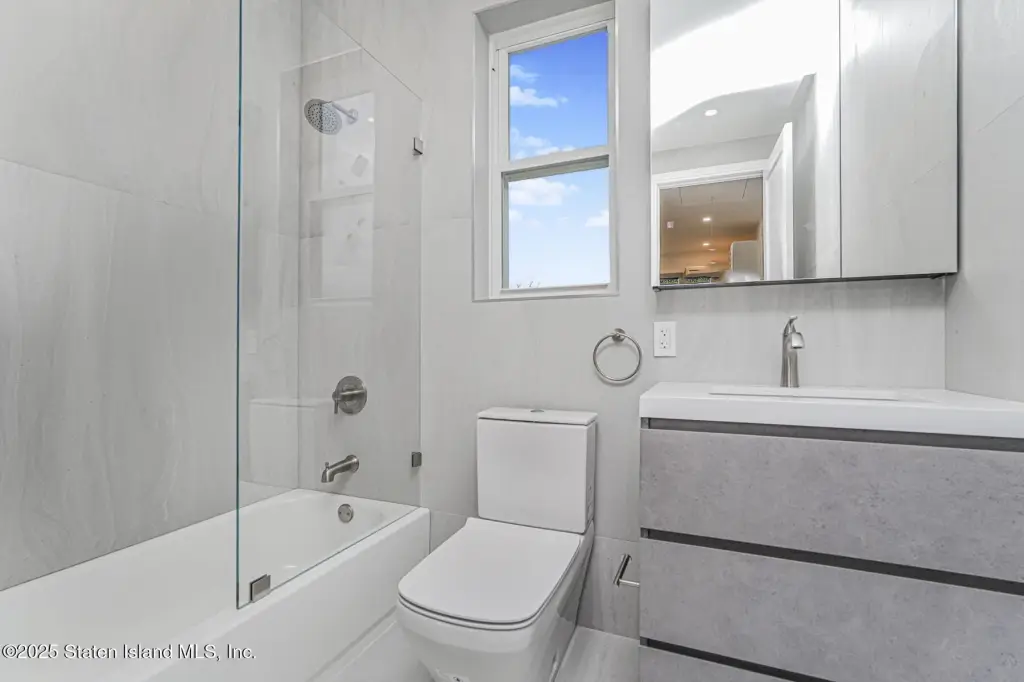
5
Full bathrooms
3
Rooms
Bedroom 1, Bedroom 6, Bedroom 2, Bathroom 3, Bathroom 1, Bedroom 4, Bathroom 4, Bathroom 5, Bathroom 2, Bedroom 5, Bedroom 3
Parking features
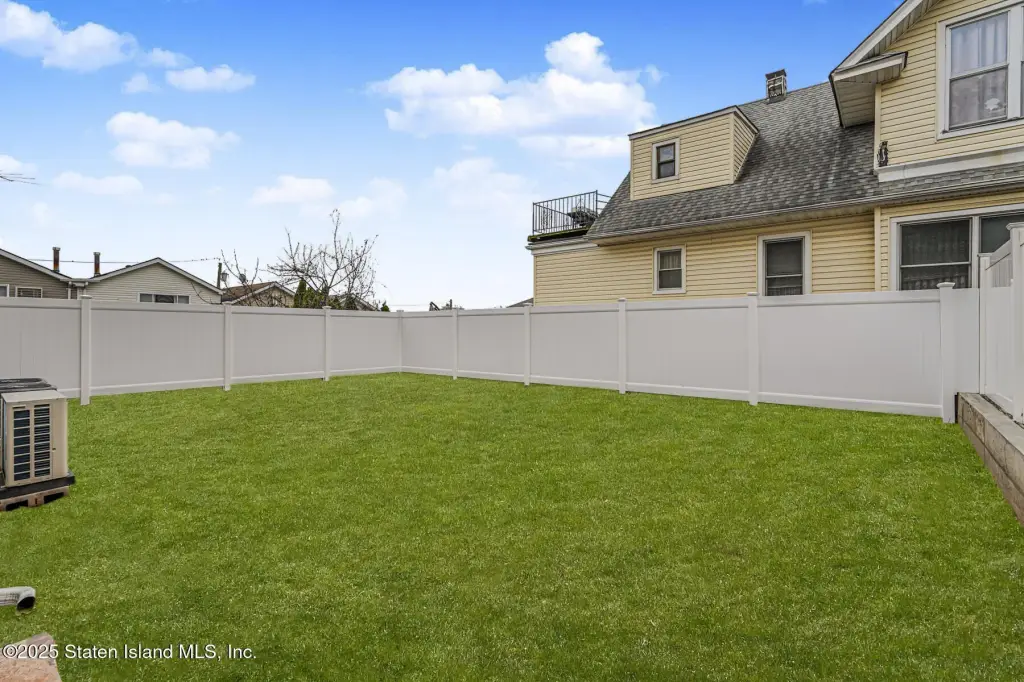
Off Street, Driveway, Carport
Fencing
Fenced
Basement
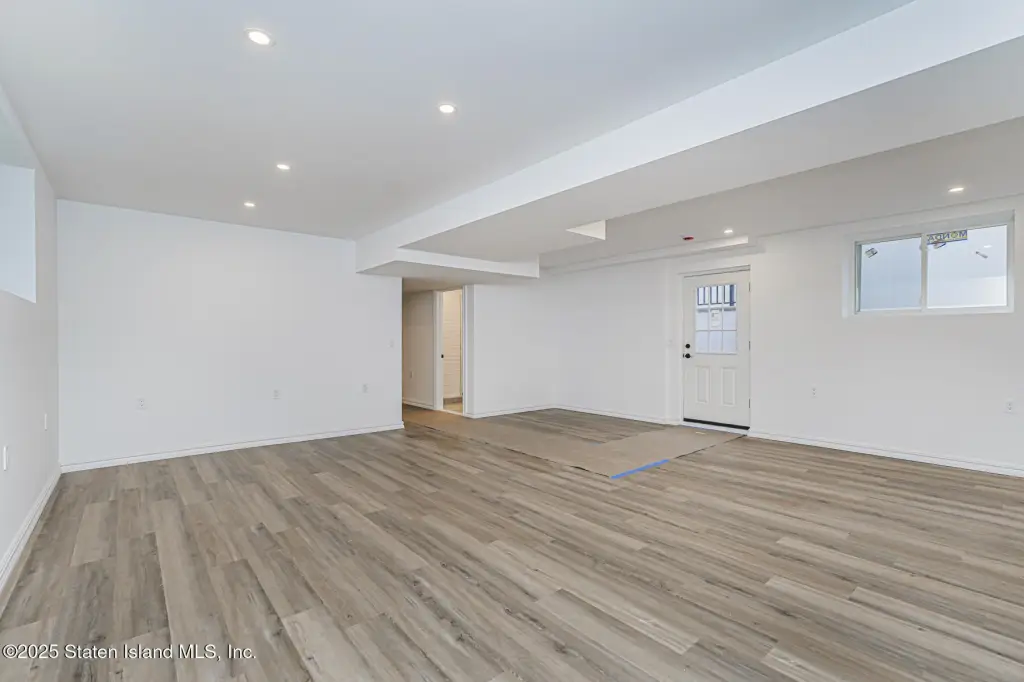
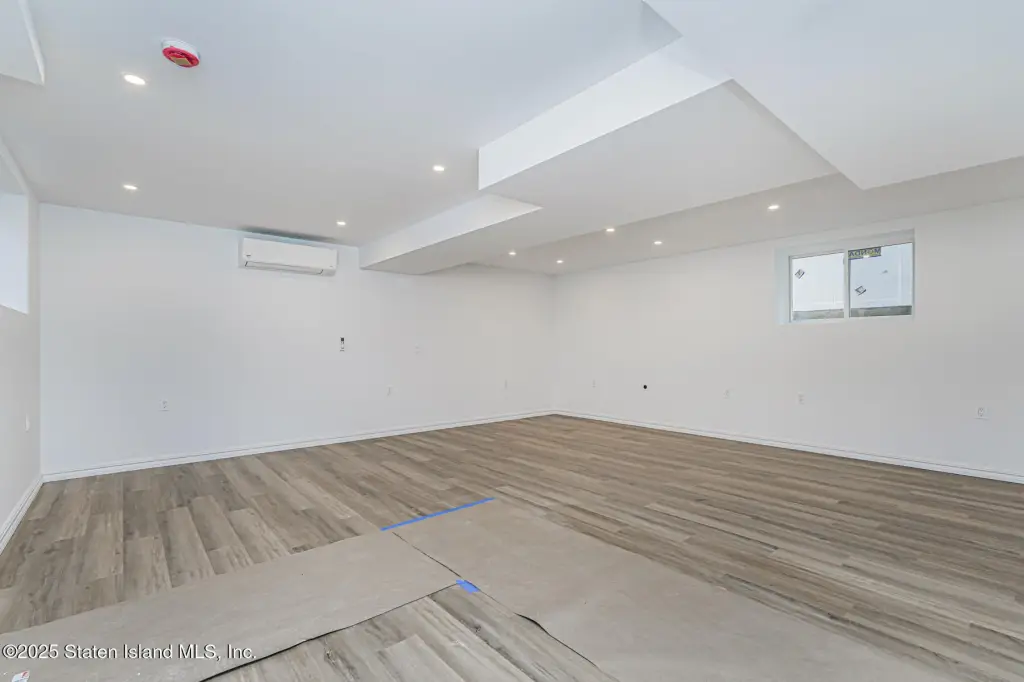
Full, Finished
Lot features
Front Yard, Back Yard
Subdivision
Old Town
Standard status
Active
APN
03221-0003
Size
3,200 SF
Lot size
0.09 Acres
Taxes and HOA fees
Tax Annual Amount
6438
Utilities
Sewer type
Public Sewer
Heating system
Natural Gas, Forced Air
Cooling system
Central Air
Building Details
Year built
2025
Floors in Building
2
Number of units
2
Building materials
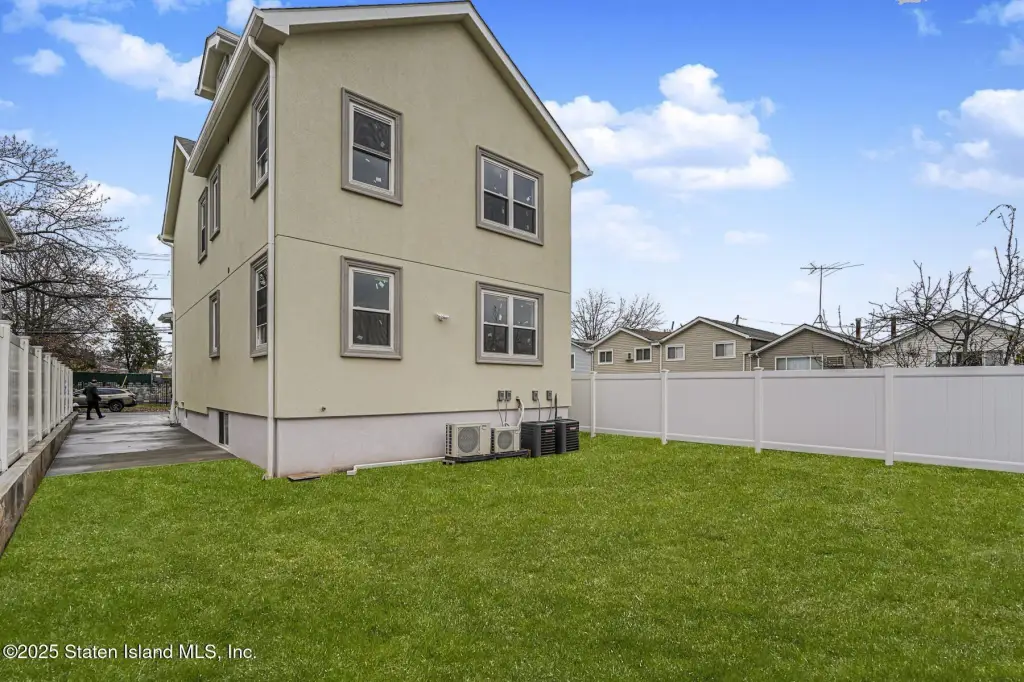
Stucco
Listing Agency:
Robert DeFalco Realty, Inc.
(718) 987-7900
Listed By:
Dritan Tony Gashi
(917) 533-8060
Added: May 4
Changed: Oct 11
Last Checked: Oct 12 at 5:06PM
MLS# 2602439
Copyright © 2026 Staten Island Board of Realtors. All rights reserved. All information provided by the listing agent/broker is deemed reliable but is not guaranteed and should be independently verified.
Investment Insights
Based on property information with market context.
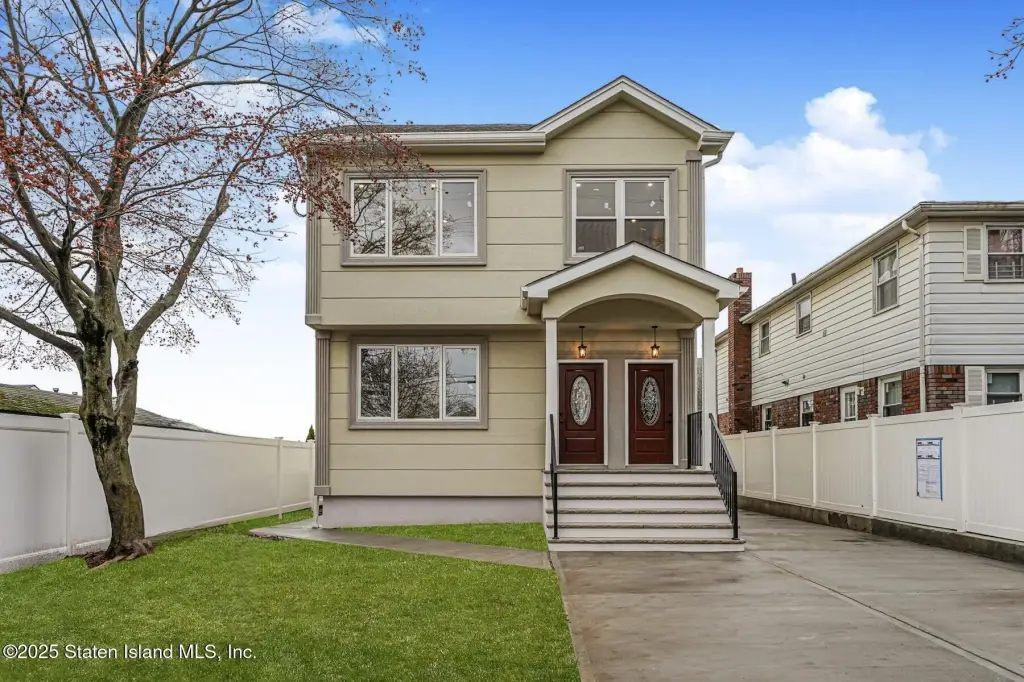
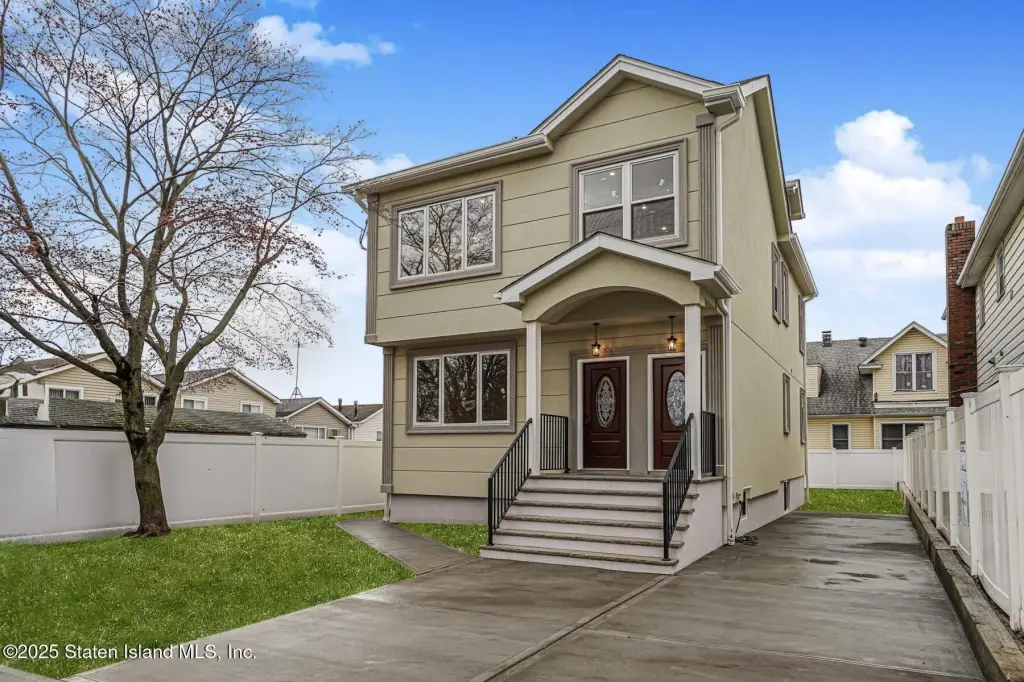
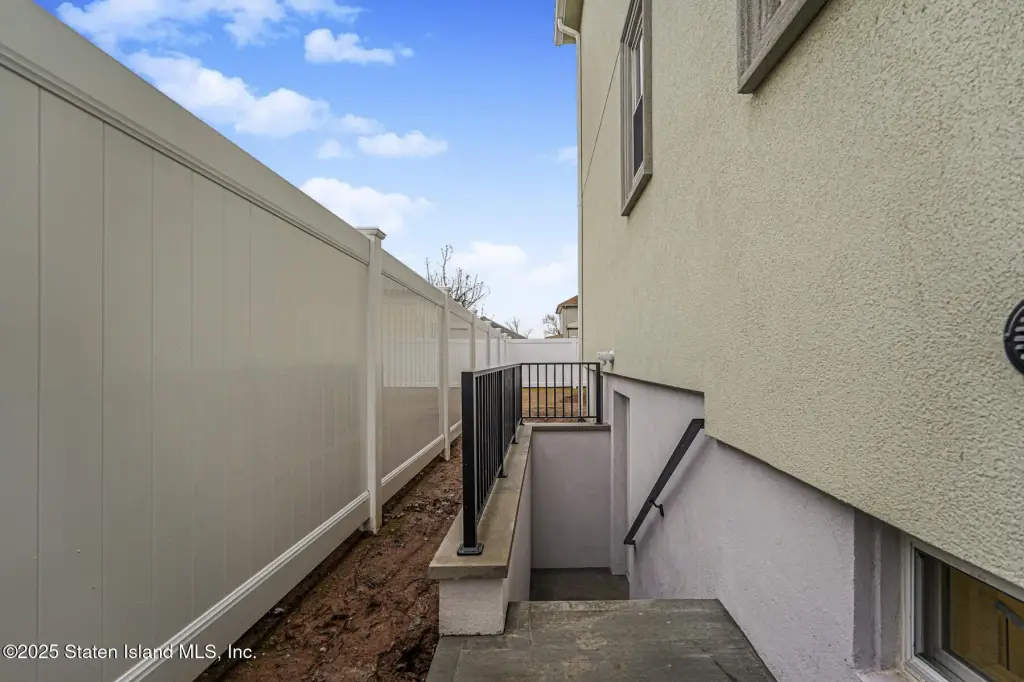
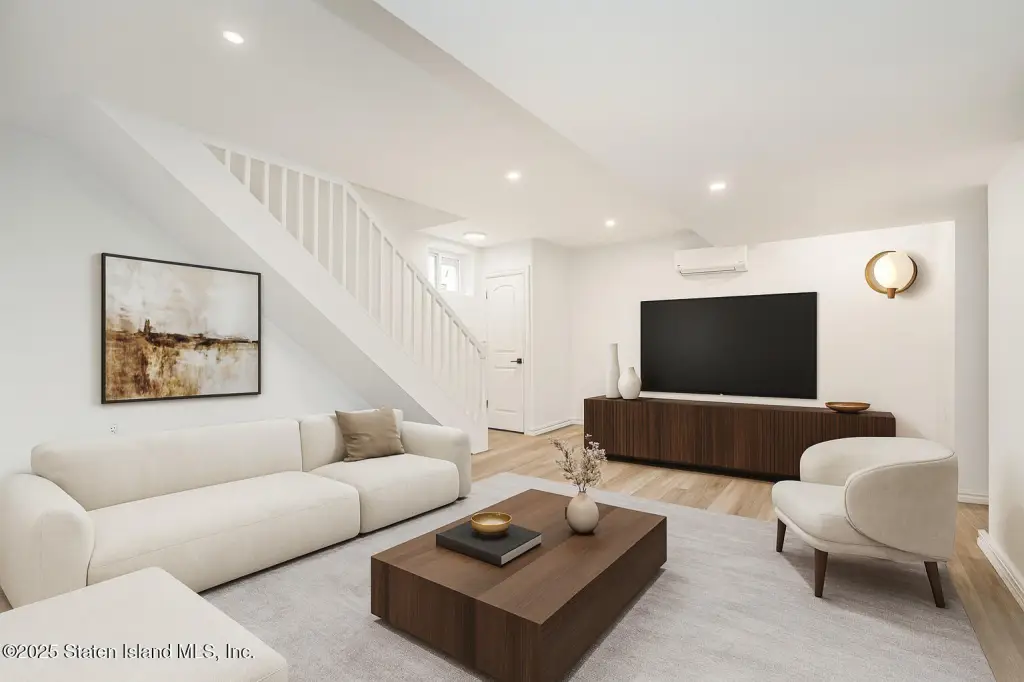
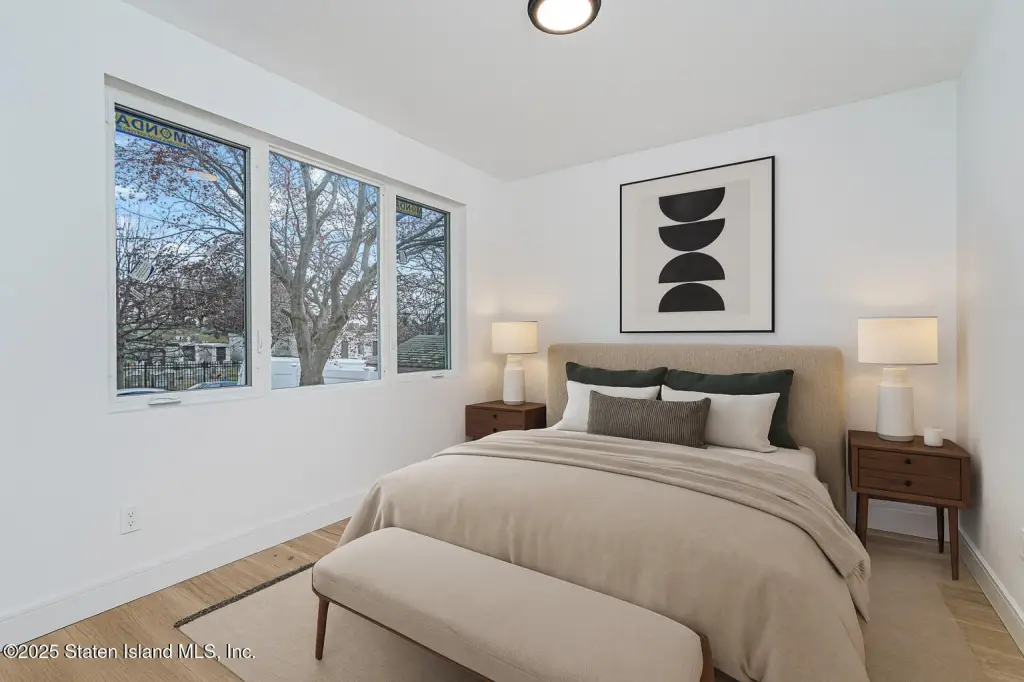
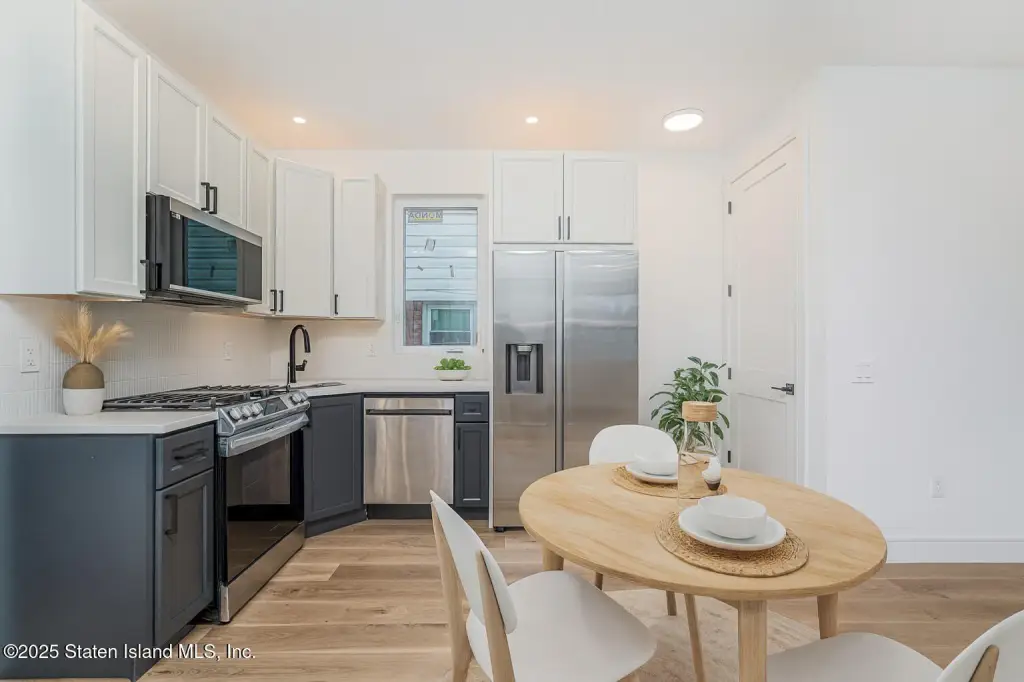
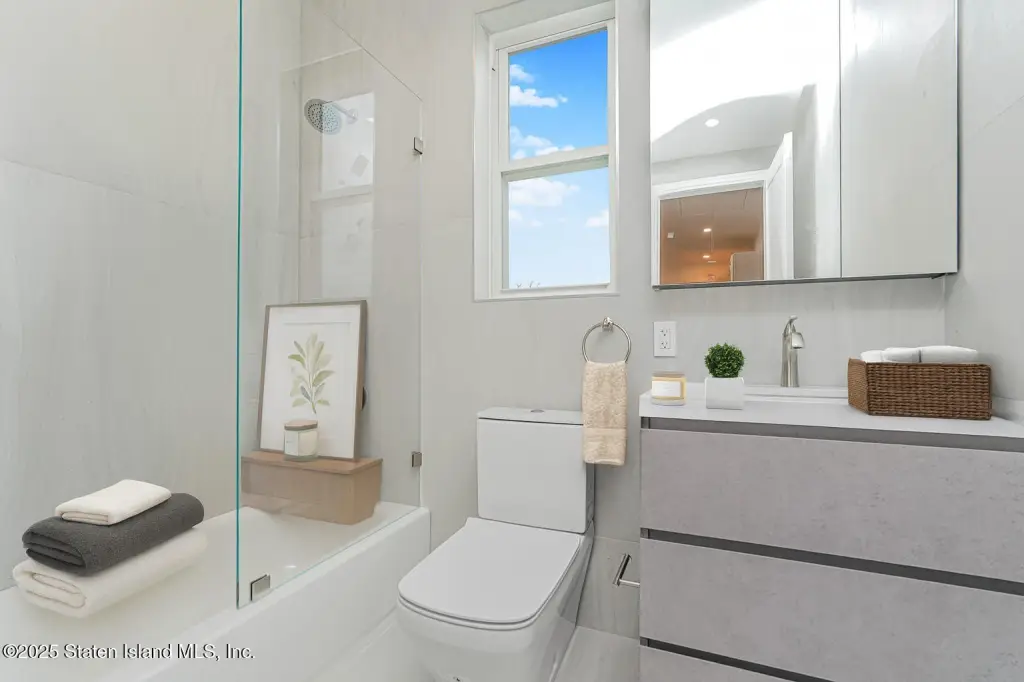
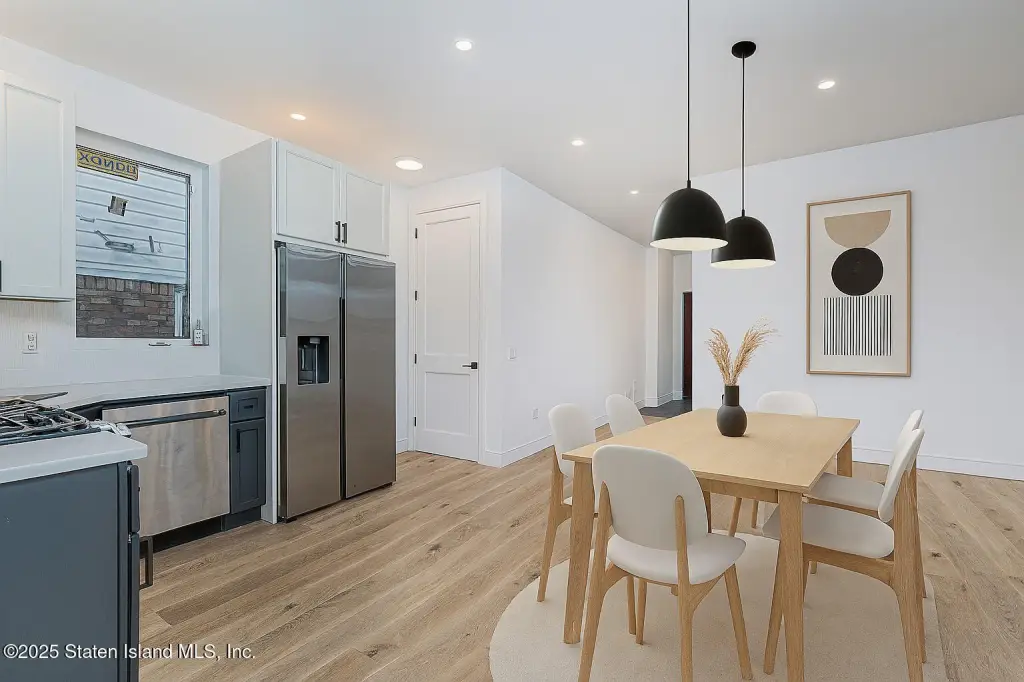
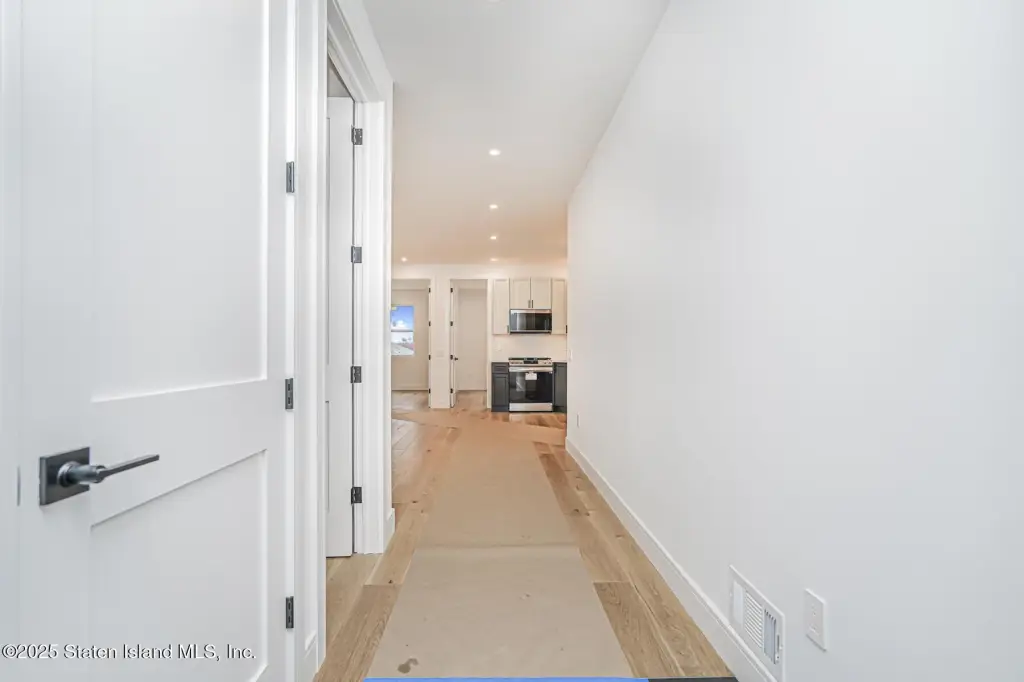
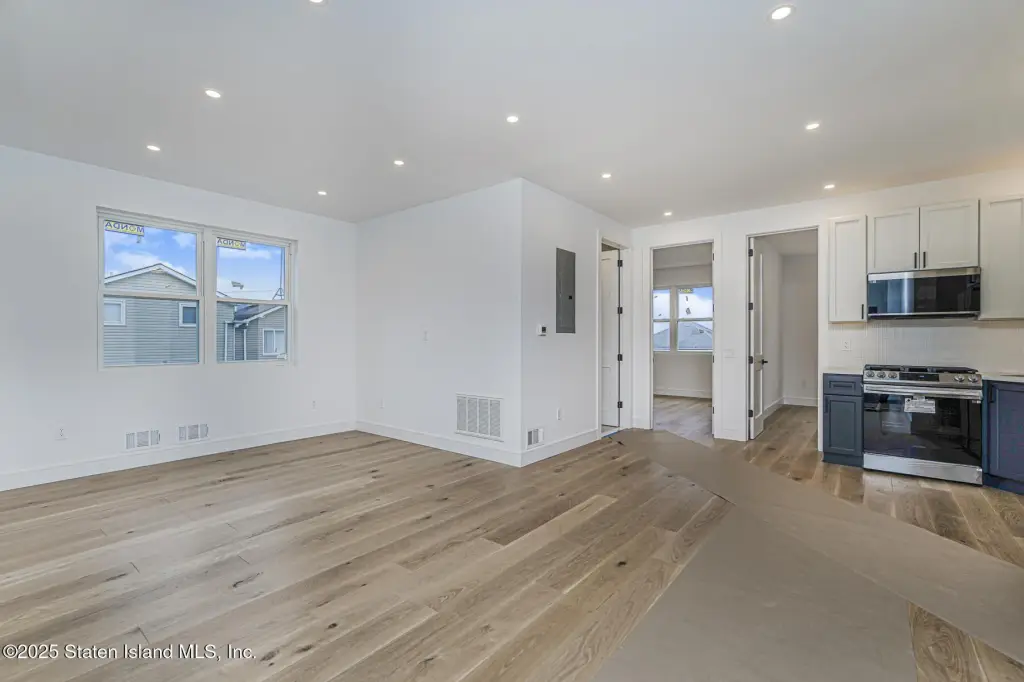
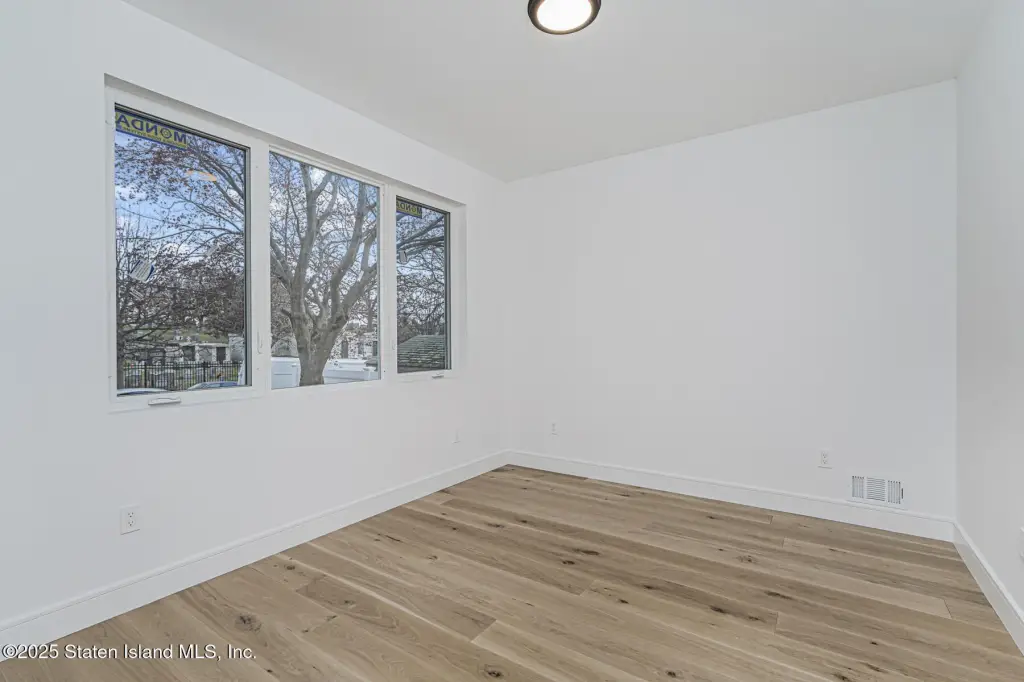
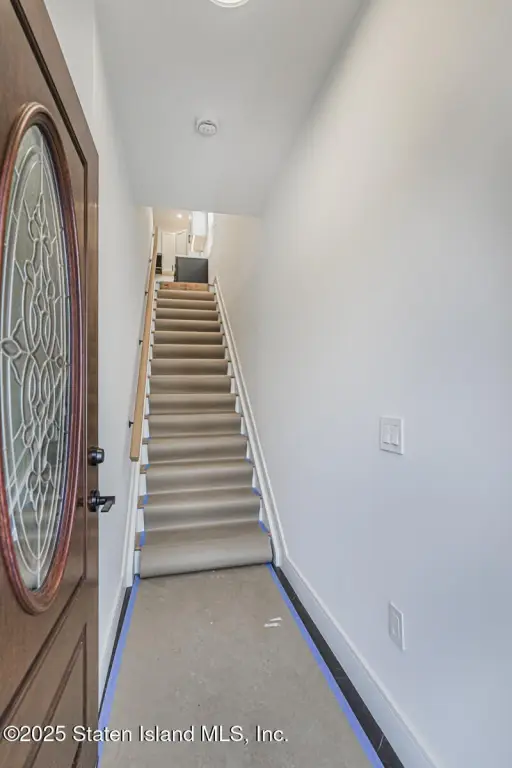
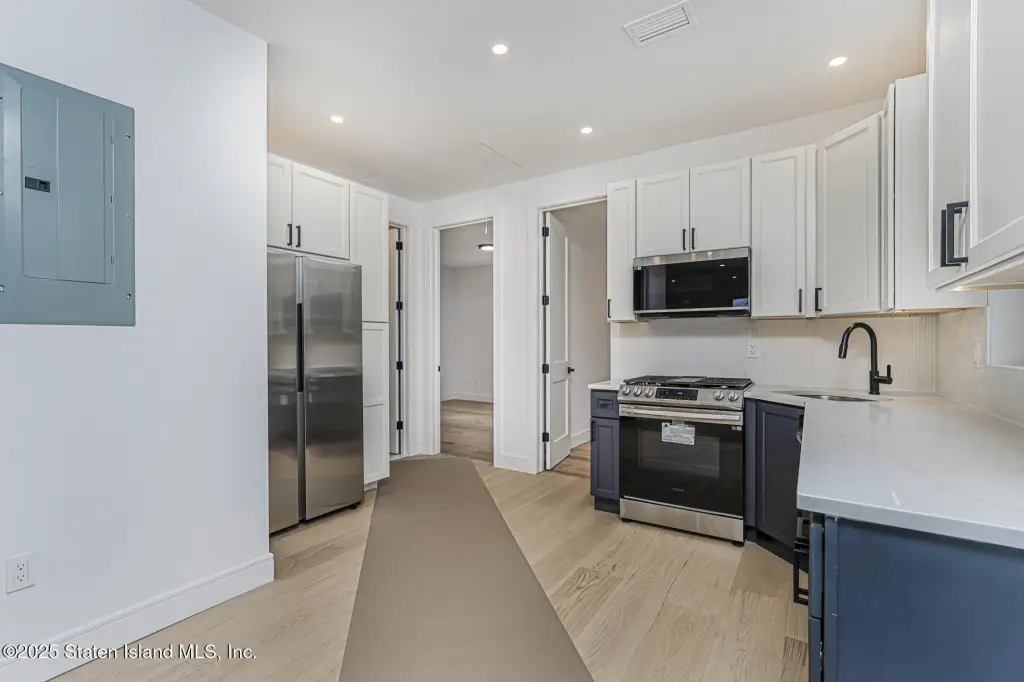
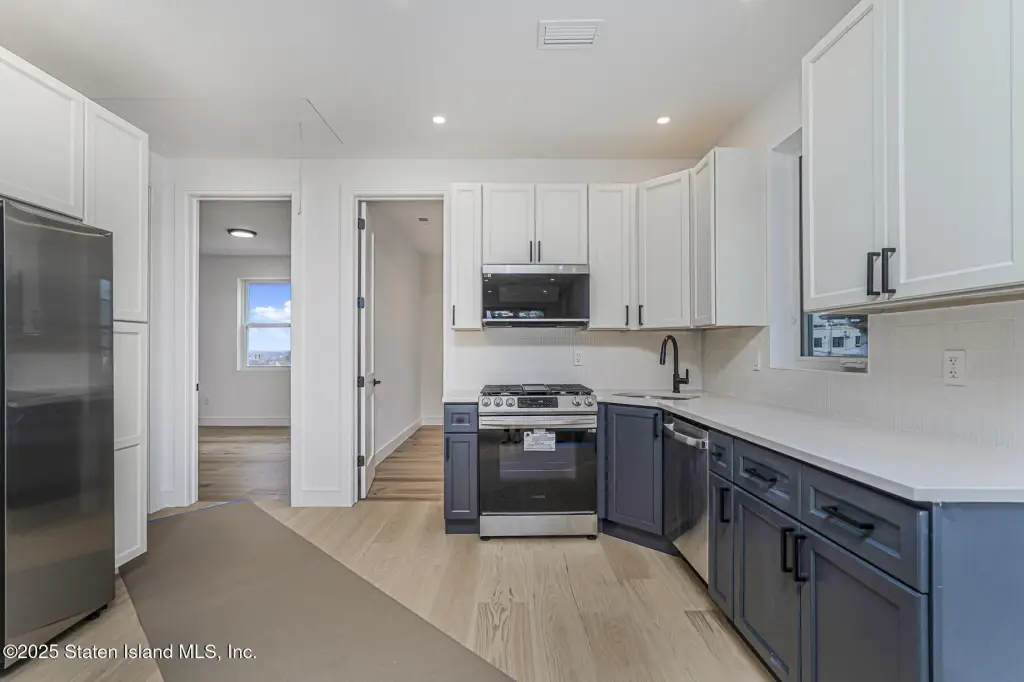
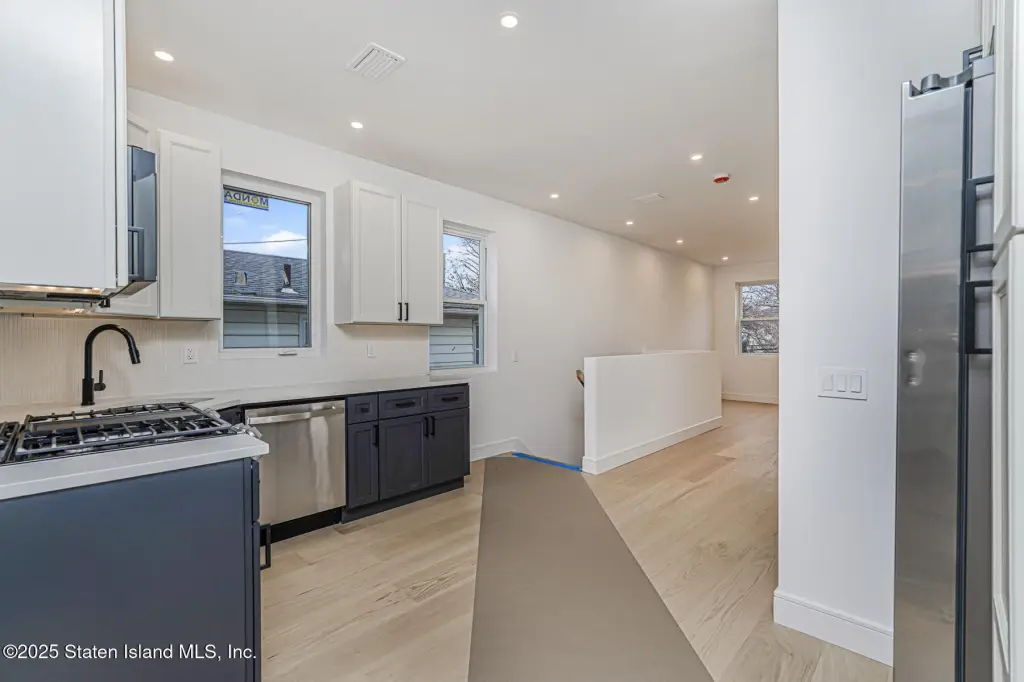
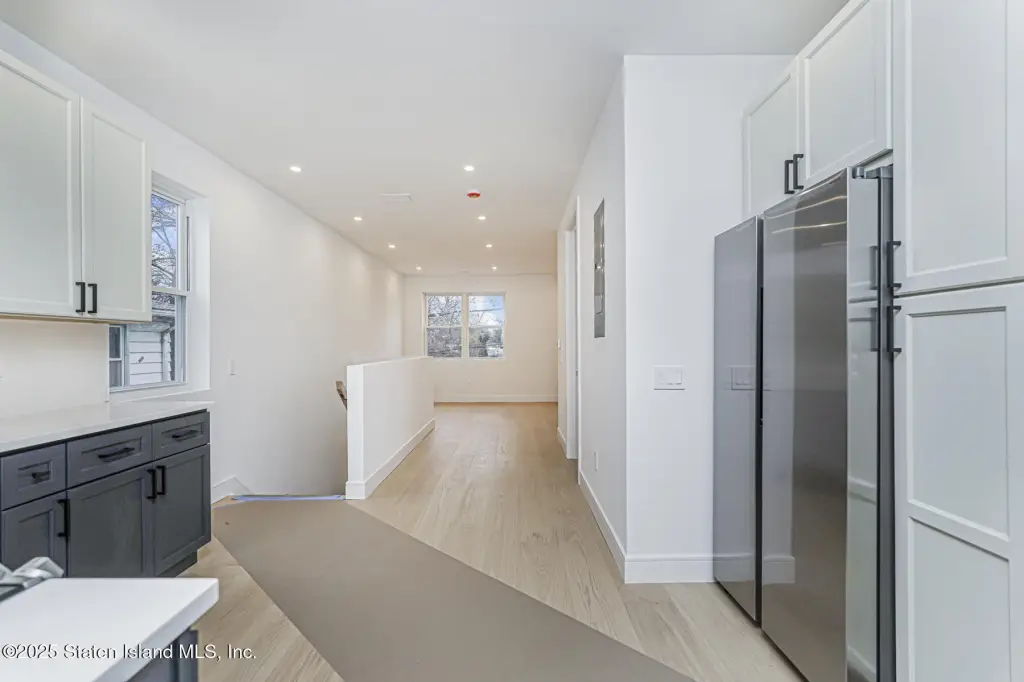
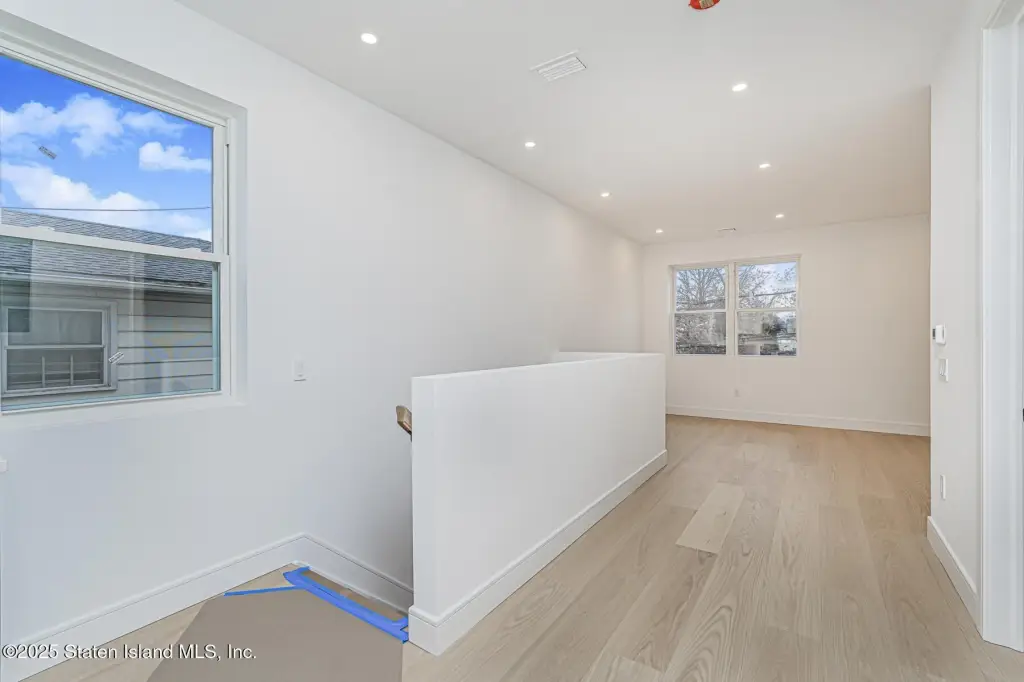
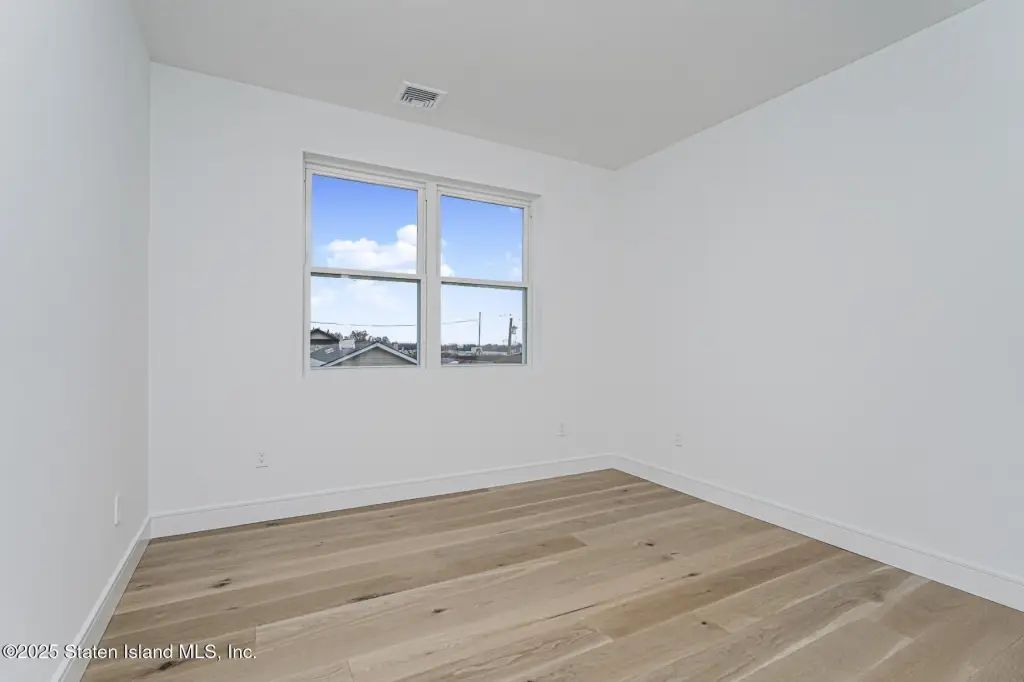
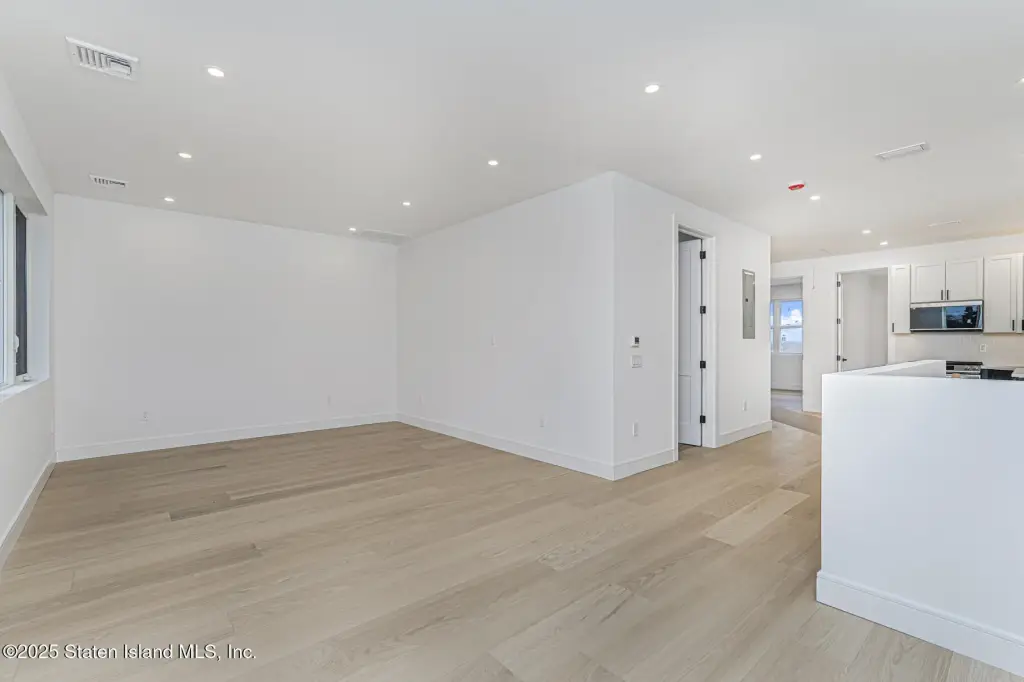
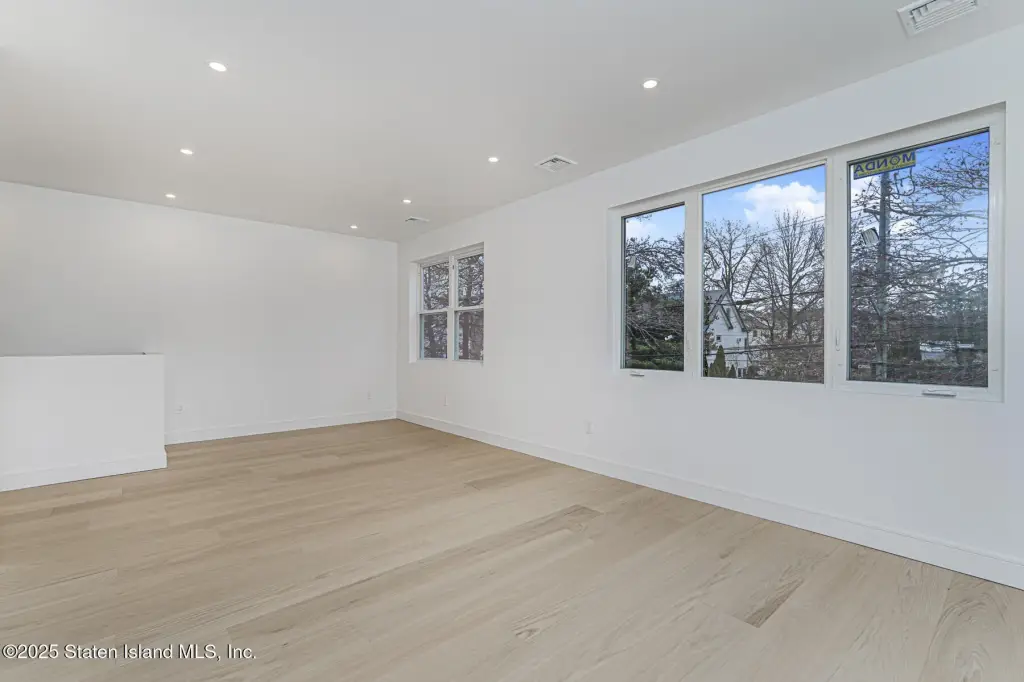
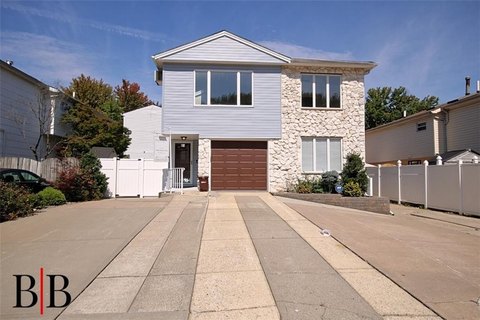
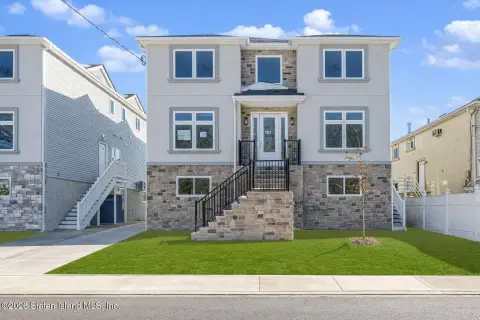
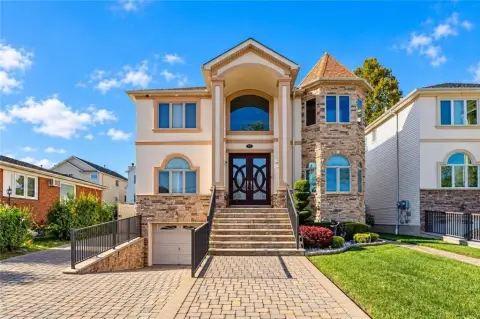
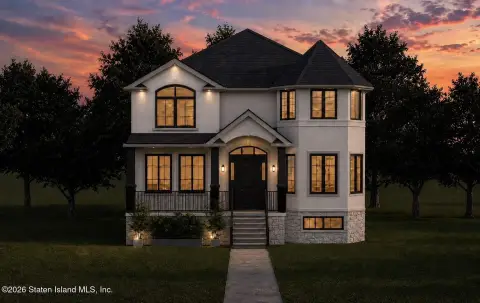
This duplex property is under construction and scheduled with a 2025 year built. The 3,200-square-foot improvement uses a 6-over-6 configuration and includes six bedrooms and five bathrooms. A separately accessed basement has its own electric meter. Stucco construction, natural-gas forced-air heat, central air conditioning, and public sewer service are specified. Parking includes a carport, driveway, and additional off-street spaces, with fencing around the property.
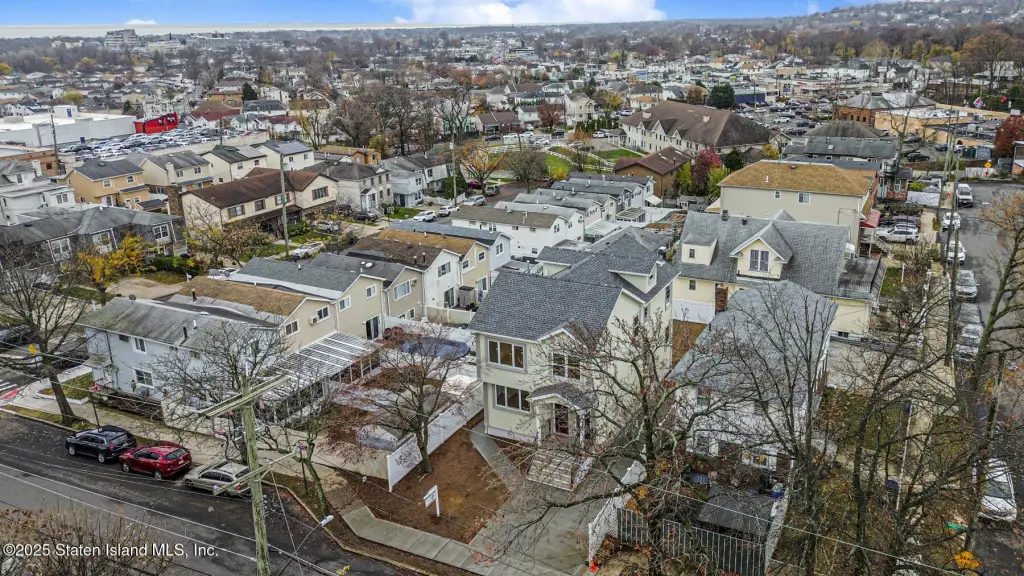
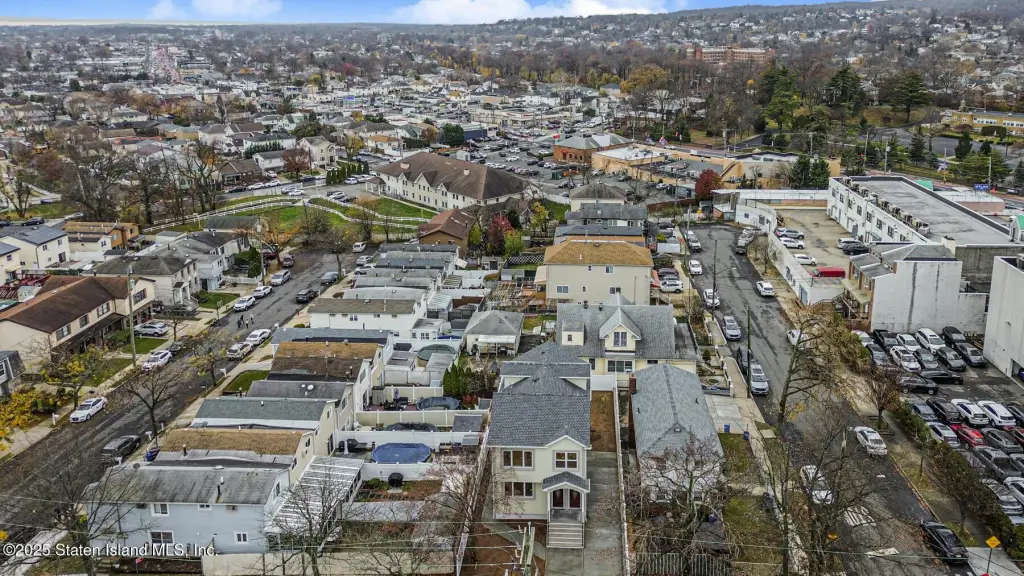
The property is located at 178 Parkinson Avenue in Staten Island, one block from Hylan Blvd and minutes from the Verrazano Bridge. The lot contains 0.0918 acres and is zoned R3-2.
The property is located at 178 Parkinson Avenue in Staten Island, one block from Hylan Blvd and minutes from the Verrazano Bridge. The lot contains 0.0918 acres and is zoned R3-2.
Key Highlights
- 3,200‑square‑foot duplex on a 0.0918‑acre lot
- 6‑over‑6 configuration with six bedrooms and five bathrooms
- Separate basement entrance and electric meter
Financial Insights
Estimated NOI and Cap Rate
NOI / Yr
$84,017
Cap Rate
6.18%
Suggested Prices Based on Cap Rates
Cap Rate 5%
$1,680,340
$1.7M
Cap Rate 7%
$1,200,243
$1.2M
Cap Rate 9%
$933,522
$933.5K
Market Conditions
NOI Build-Up for 3,200 SF
Gross rent
$130.6K $40.80/SF
− Vacancy
−$10.5K −$3.29/SF
EGI
$120.0K $37.51/SF
− OpEx
−$36.0K −$11.25/SF
NOI
$84.0K $26.26/SF
Area
ZIP 10305
Vacancy
8.07%
Lease Rate
$40.80 /SF/Yr
Expense Ratio
30.00%
Simulate Cap Rate and NOI
Suggested Prices Based on Cap Rates
Cap Rate 5%
$1,680,340
Cap Rate 7%
$1,200,243
Cap Rate 9%
$933,522
Alternative Uses
Best Use
Multifamily LT 5
$1.20M
$1.05M – $1.40M
NOI $84,017 @ 7.0% cap · market cap 6.18%
Second Best
Apartment 5plus
$1.10M
$966.2K – $1.29M
NOI $77,299 @ 7.0% cap · market cap 5.69%
Theoretical Best
Office A
$1.53M
$1.34M – $1.78M
NOI $106,881 @ 7.0% cap · market cap 7.86%
Zoning and permitted uses should be independently verified with authorities.
How Realmo checks its estimates
Property Analytics
Unlock full access to Insights
Subscribe to Realmo Intelligence
Open Analytics
Current Use
Location Intelligence
Trade Area within ½ mile
1,186
Businesses Nearby
Explore this area
Business Placement
Demographics for 10305, NY
44,008
Population
16,850
Households
2.6
Avg Household Size
41
Median Age
32%
College-Educated
85%
High-School Grad
4.0 sq mi
ZIP Area
11,002
Density / Sq Mi
$86,294
Median Household Income
$52,183
Median Earnings
$1,656
Median Rent
$627,200
Median Home Value
Check the figures for this property
Cap Rate, Value Estimation, Potential NOI and more
View Realmo Analytics
Market
Vacancy Rate% for Multifamily in Northeast region

Questions? Ask Rey
Realmo’s AI knows this listing — price, zoning, demand, history. Ask anything.
Frequently Asked Questions
What type of property is this?
Duplex - Under-construction two-family property with separate basement access, dedicated electric metering, and off-street parking.
Where is this duplex located?
The property is located at 178 Parkinson Avenue Staten Island, NY.
What is the asking price?
The asking price for this property is $1,359,000.
What are key features of this property?
This property features: 3,200‑square‑foot duplex on a 0.0918‑acre lot; 6‑over‑6 configuration with six bedrooms and five bathrooms; Separate basement entrance and electric meter


