Established Restaurant and Lounge in
For Sale
$299,900
176 W Fulton Street, Gloversville, NY 12078
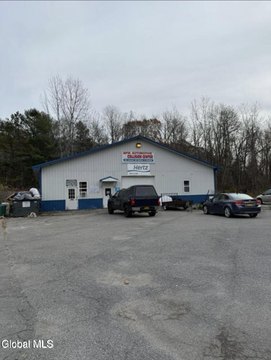
Restaurant and lounge with banquet room and parking in Gloversville.
Property Size3,240 SF
Price / SF$92.56
Days on Market267
Property Features for 176 W Fulton Street
General Information
Standard status
Active
Size
3,240 SF
Total Parking Spaces
28
Zoning
Commercial
Taxes and HOA fees
Annual Taxes
$5,866
Building Details
Year Built
1966
Buildings
1
Stories
1
Listing Agency:
Coldwell Banker Prime Properties
Listed By:
Thomas Marks · License #30MA0342302
(518) 421-1400
Source:
Capmarkrealty
Added: Jan 26
Changed: Oct 8
Last Checked: Oct 19 at 4:02AM
Displayed information is deemed reliable but is not guaranteed and should be independently verified. All listing content including descriptions, pricing, images are the copyrighted material of Coldwell Banker Prime Properties

Ask AI about this property
Review the available facts, identify missing information and prepare questions for the agent.
Investment Insights
Based on property information with market context.
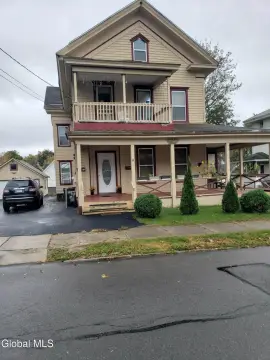
Located in Gloversville, this restaurant and lounge presents a unique opportunity. The property has been operating for almost six decades under consistent ownership. It is equipped to accommodate large gatherings, featuring two dining rooms with seating for 120 people and a banquet room that can accommodate an additional 125 people. The venue provides handicap access. There are three fully outfitted kitchens and two walk-in coolers. The property includes 20 on-site parking spaces. Adjacent to the property, there is an optional 2-family home with 8 additional parking spots available for purchase.
Key Highlights
- Established restaurant and lounge with nearly 60 years of consistent ownership.
- Large capacity: Two dining rooms (120 seats) and a banquet room (125 seats).
- Three fully outfitted kitchens and two walk‑in coolers.
Financial Insights
Estimated NOI and Cap Rate
NOI / Yr
$12,466
Cap Rate
4.16%
Suggested Prices Based on Cap Rates
Cap Rate 5%
$249,320
$249.3K
Cap Rate 7%
$178,086
$178.1K
Cap Rate 9%
$138,511
$138.5K
Market Conditions
NOI Build-Up for 3,240 SF
Gross rent
$58.3K $18.00/SF
− Vacancy
−$32.1K −$9.90/SF
EGI
$26.2K $8.10/SF
− OpEx
−$13.8K −$4.25/SF
NOI
$12.5K $3.85/SF
Area
Fulton County, NY
Vacancy
55.00%
Lease Rate
$18.00 /SF/Yr
Expense Ratio
52.50%
Simulate Cap Rate and NOI
Suggested Prices Based on Cap Rates
Cap Rate 5%
$249,320
Cap Rate 7%
$178,086
Cap Rate 9%
$138,511
Alternative Uses
Best Use
Specialty Retail
$650.5K
$569.2K – $758.9K
NOI $45,535 @ 7.0% cap · market cap 15.18%
Second Best
Hotel Hospitality
$178.1K
$155.8K – $207.8K
NOI $12,466 @ 7.0% cap · market cap 4.16%
Theoretical Best
Multifamily LT 5
$2.24M
$1.96M – $2.61M
NOI $156,791 @ 7.0% cap · market cap 52.28%
Zoning and permitted uses should be independently verified with authorities.
How Realmo checks its estimates
Property Analytics
Unlock full access to Insights
Subscribe to Realmo Intelligence
Open Analytics
Current Use
Location Intelligence
Trade Area within ½ mile
600
Businesses Nearby
Under-served
Demand for This Use
Explore this area
Business Placement
Demographics for 12078, NY
23,009
Population
11,668
Households
2
Avg Household Size
44
Median Age
18%
College-Educated
87%
High-School Grad
110.8 sq mi
ZIP Area
208
Density / Sq Mi
$54,565
Median Household Income
$36,769
Median Earnings
$908
Median Rent
$122,400
Median Home Value
Check the figures for this property
Cap Rate, Value Estimation, Potential NOI and more
View Realmo Analytics
Market
Vacancy Rate% for Retail in Northeast region





Frequently Asked Questions
What type of property is this?
Restaurant - Restaurant and lounge with banquet room and parking in Gloversville.
Where is this restaurant located?
The property is located at 176 W Fulton Street Gloversville, NY.
What is the asking price?
The asking price for this property is $299,900.
What are key features of this property?
This property features: Established restaurant and lounge with nearly 60 years of consistent ownership.; Large capacity: **Two dining rooms (120 seats) and a banquet room (125 seats).**; Three fully outfitted kitchens and two walk‑in coolers.


