Duplex Property with Detached
For Sale
$639,900
173-175 Johnson Street, Springfield, MA 01108
Two rented homes and a multi-door garage building provide residential income space with additional storage and parking.
Property Size3,300 SF
Price / SF$193.91
Days on Market48
Property Features for 173-175 Johnson Street
General Information
Standard status
Active
Size
3,300 SF
Total Parking Spaces
29
Property subtype
Residential Income
Zoning
R2
Occupancy
100%
Net Operating Income
$39,000
Site & Location
Neighborhood
Forest Park
Units
Unit Mix
2 x 3BR/1BA
Multifamily Units
2
Taxes and HOA fees
Annual Taxes
$5,885
Building Details
Building Size
3,300 SF
Year Built
1901
Buildings
3
Tenancy
Multi
Listing Agency:
Class Realty, Inc.
Listed By:
Nikolay Yusenko · License #9035453
(413) 348-0950
Source:
413realestate
Added: Sep 9
Changed: Oct 25
Last Checked: Oct 24 at 2:15PM
Displayed information is deemed reliable but is not guaranteed and should be independently verified. All listing content including descriptions, pricing, images are the copyrighted material of Class Realty, Inc.

Ask AI about this property
Review the available facts, identify missing information and prepare questions for the agent.
Investment Insights
Based on property information with market context.
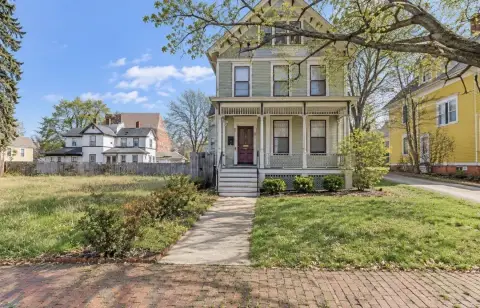
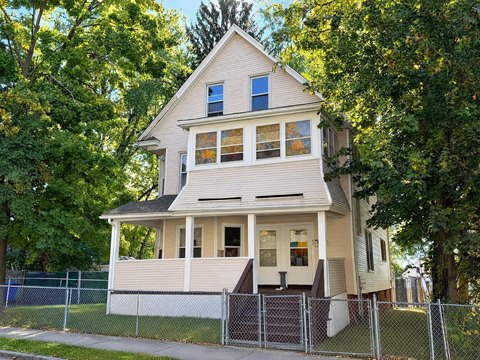
This R2-zoned duplex property includes two single-family residences and a detached garage building. The homes share a practical layout with living rooms, kitchens, dining areas, three bedrooms, and full bathrooms. Interior and exterior features include hardwood floors, wood cabinetry, decks, vinyl siding, and gas heat. One residence also has a partially finished basement with two rooms and a bathroom. The property was built in 1901 and contains 3,300 square feet.
The detached garage building adds substantial utility, with eleven garage doors accommodating up to sixteen vehicles. A second-floor area provides additional storage. Both residences are currently occupied under month-to-month rental arrangements, creating multiple income-producing components at 173-175 Johnson Street in Springfield.
The detached garage building adds substantial utility, with eleven garage doors accommodating up to sixteen vehicles. A second-floor area provides additional storage. Both residences are currently occupied under month-to-month rental arrangements, creating multiple income-producing components at 173-175 Johnson Street in Springfield.
Key Highlights
- Two single‑family residences, each with three bedrooms and one full bathroom
- Detached garage building with eleven garage doors
- Garage capacity for up to sixteen vehicles
Financial Insights
Estimated NOI and Cap Rate
NOI / Yr
$48,846
Cap Rate
7.63%
Suggested Prices Based on Cap Rates
Cap Rate 5%
$976,920
$976.9K
Cap Rate 7%
$697,800
$697.8K
Cap Rate 9%
$542,733
$542.7K
Market Conditions
NOI Build-Up for 3,300 SF
Gross rent
$73.3K $22.20/SF
− Vacancy
−$3.5K −$1.05/SF
EGI
$69.8K $21.15/SF
− OpEx
−$20.9K −$6.34/SF
NOI
$48.8K $14.80/SF
Area
Springfield, MA
Vacancy
4.75%
Lease Rate
$22.20 /SF/Yr
Expense Ratio
30.00%
Simulate Cap Rate and NOI
Suggested Prices Based on Cap Rates
Cap Rate 5%
$976,920
Cap Rate 7%
$697,800
Cap Rate 9%
$542,733
Alternative Uses
Best Use
Multifamily LT 5
$697.8K
$610.6K – $814.1K
NOI $48,846 @ 7.0% cap · market cap 7.63%
Second Best
Apartment 5plus
$620.7K
$543.1K – $724.2K
NOI $43,451 @ 7.0% cap · market cap 6.79%
Theoretical Best
Office A
$896.1K
$784.1K – $1.05M
NOI $62,726 @ 7.0% cap · market cap 9.80%
Zoning and permitted uses should be independently verified with authorities.
How Realmo checks its estimates
Property Analytics
Lease Details
2
Residential units
100%
Occupancy
Multi-tenant
Tenancy
Location Intelligence
Trade Area within ½ mile
973
Businesses Nearby
Explore this area
Business Placement
Demographics for 01108, MA
27,671
Population
11,332
Households
2.4
Avg Household Size
33
Median Age
21%
College-Educated
81%
High-School Grad
3.4 sq mi
ZIP Area
8,139
Density / Sq Mi
$51,851
Median Household Income
$34,539
Median Earnings
$1,224
Median Rent
$219,500
Median Home Value
Market
Vacancy Rate% for Multifamily in Northeast region






Frequently Asked Questions
What type of property is this?
Duplex - Two rented homes and a multi-door garage building provide residential income space with additional storage and parking.
Where is this duplex located?
The property is located at 173-175 Johnson Street Springfield, MA.
What is the asking price?
The asking price for this property is $639,900.
What are key features of this property?
This property features: Two single‑family residences, each with three bedrooms and one full bathroom; Detached garage building with eleven garage doors; Garage capacity for up to sixteen vehicles


