Townhouse-Style Quadplex with
For Sale
$799,900
1725 SALISHAN St, Salem, OR 97302
MultiFamily, Salem, OR
Property Size4,336 SF
Lot Size0.29 Acres
Price / SF$184.48
Days on Market48
Property Features for 1725 SALISHAN St
General Information
Property type
Residential Multi Family
Property subtype
Other
Zoning
RM2
Bedrooms
8
Bathrooms
8
Full bathrooms
8
Rooms
Bathroom 3, Bathroom 5, Bedroom 4, Bathroom 2, Bathroom 7, Bedroom 5, Bathroom 8, Bedroom 1, Bedroom 2, Bedroom 6, Bedroom 8, Bedroom 7, Bathroom 4, Bathroom 6, Bedroom 3, Bathroom 1
Elementary school
Morningside
Middle school
Leslie
High school
South Salem
Directions
S on Pringle, Right on Salishan
Subdivision
_173
Standard status
Active
APN
580382
Size
4,336 SF
Lot size
0.29 Acres
Taxes and HOA fees
Tax Description
LAGUNA VILLAGE SOUTH II SUBDIVISION, BLOCK 1, LOT 9, ACRES 0.29
Tax Annual Amount
6982
Legal Description
LAGUNA VILLAGE SOUTH II SUBDIVISION, BLOCK 1, LOT 9, ACRES 0.29
Utilities
Heating system
Zoned
Amenities
washer/dryer hookups
private deck
attached single-car garage
low-maintenance landscaping
Building Details
Year built
1976
Floors in Building
2
Number of units
4
Roof type
Composition
Listing Agency:
HomeSmart Realty Group · HomeSmart International
(971) 599-5865
Listed By:
Brian Smith
(503) 551-8510
Added: Aug 21
Changed: Sep 28
Last Checked: Oct 7 at 5:06PM
MLS# 677730878
Copyright © 2026 Regional Multiple Listing Services. All rights reserved. All information provided by the listing agent/broker is deemed reliable but is not guaranteed and should be independently verified.
Investment Insights
Based on property information with market context.
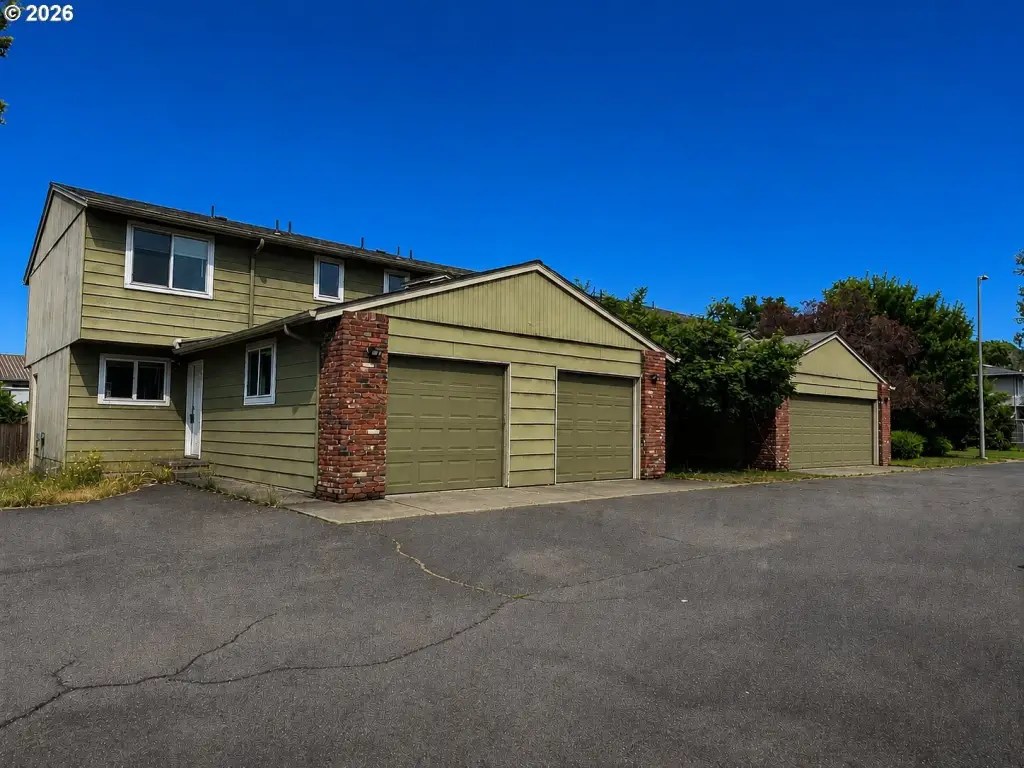
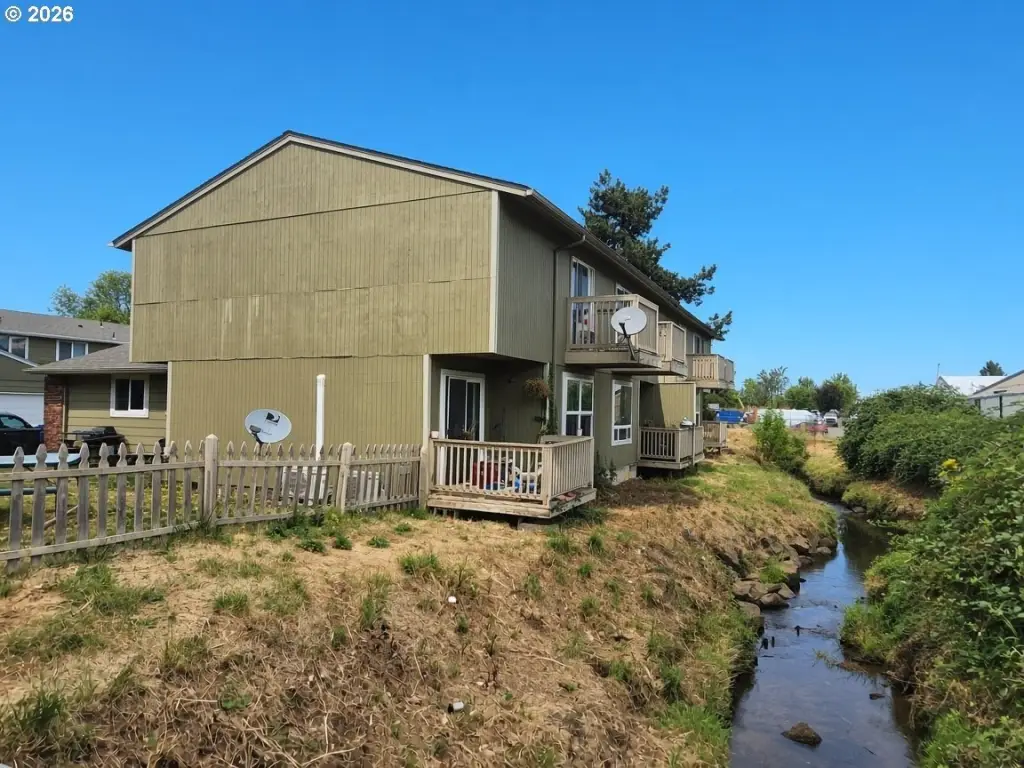
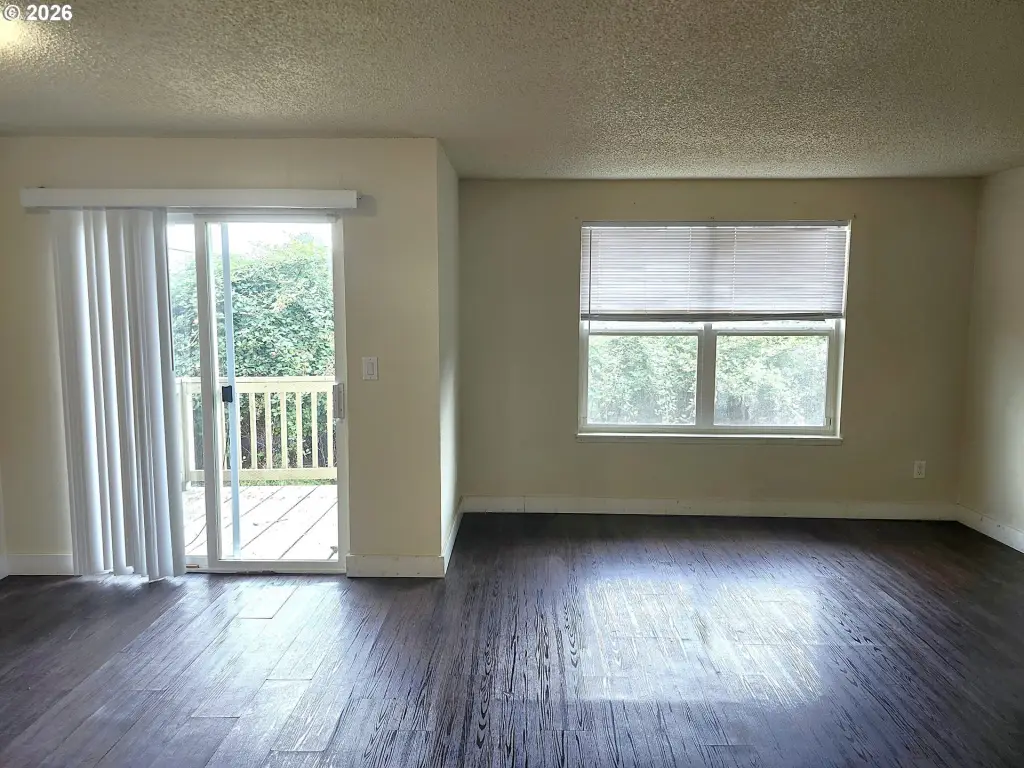
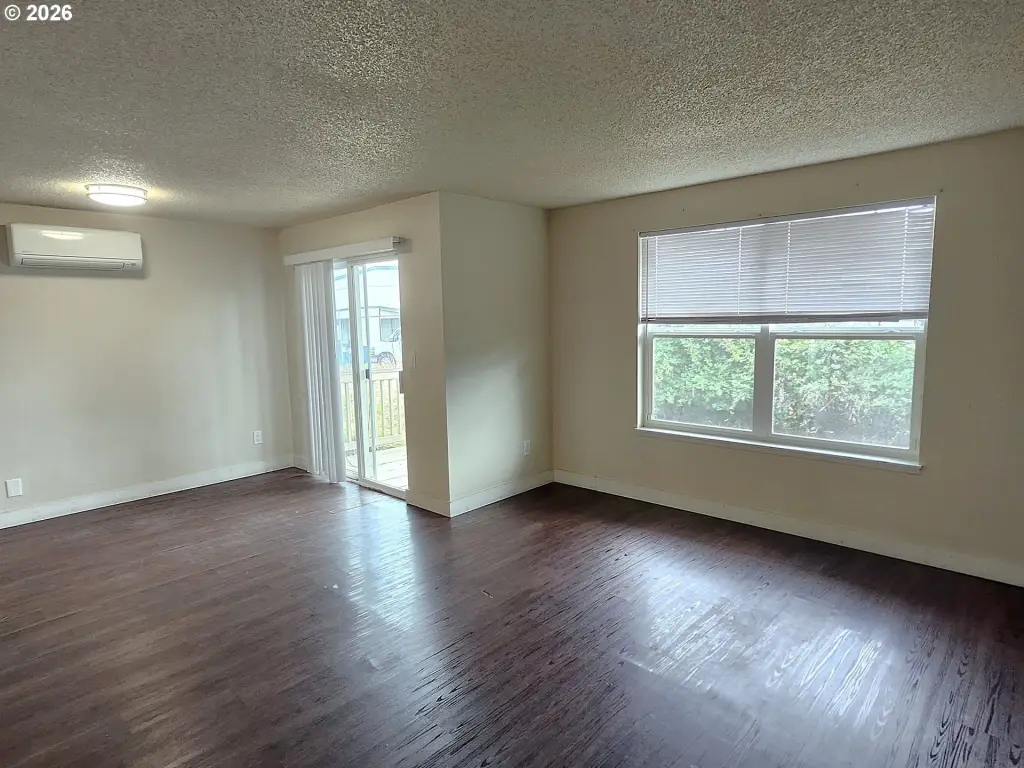
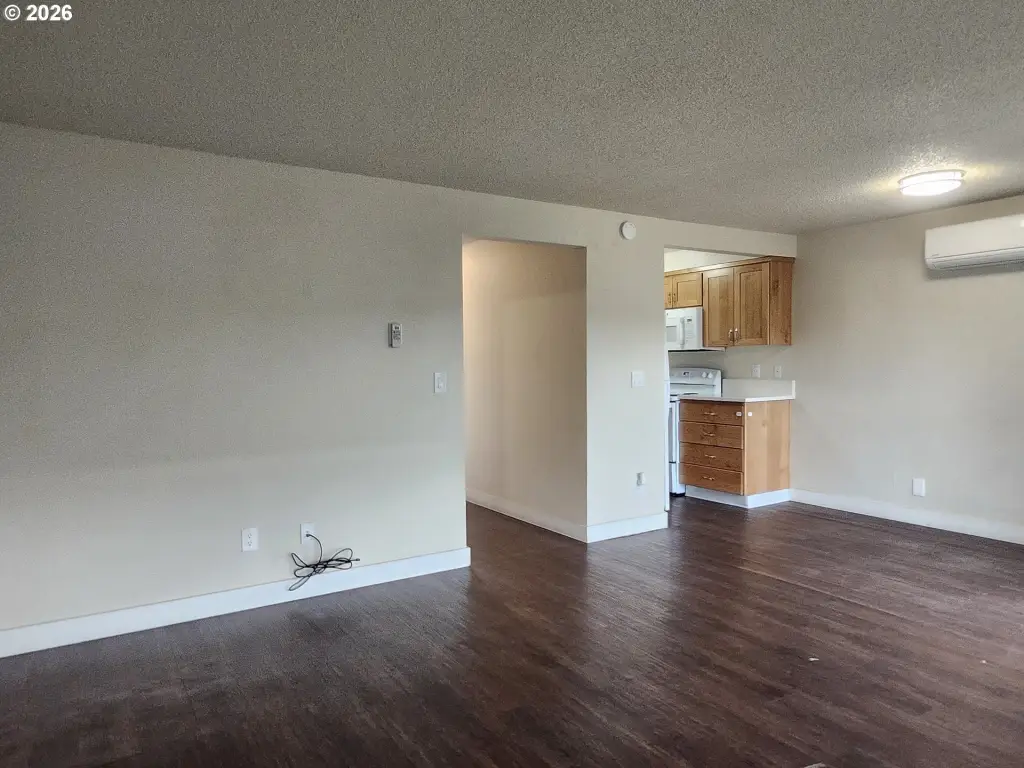
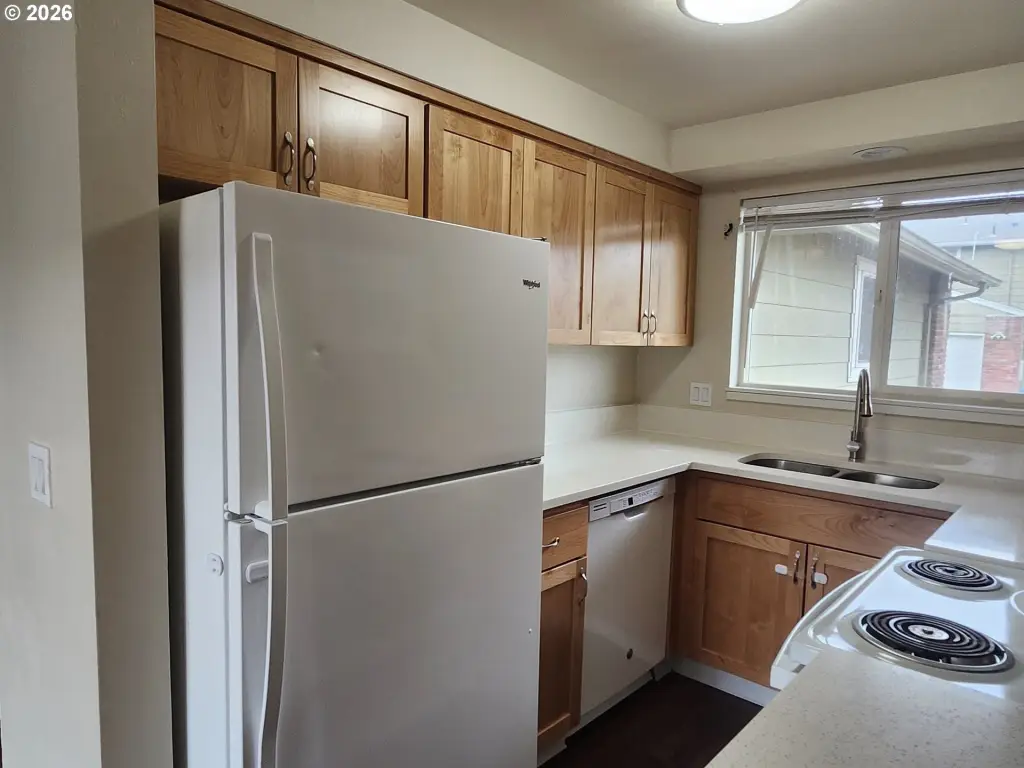
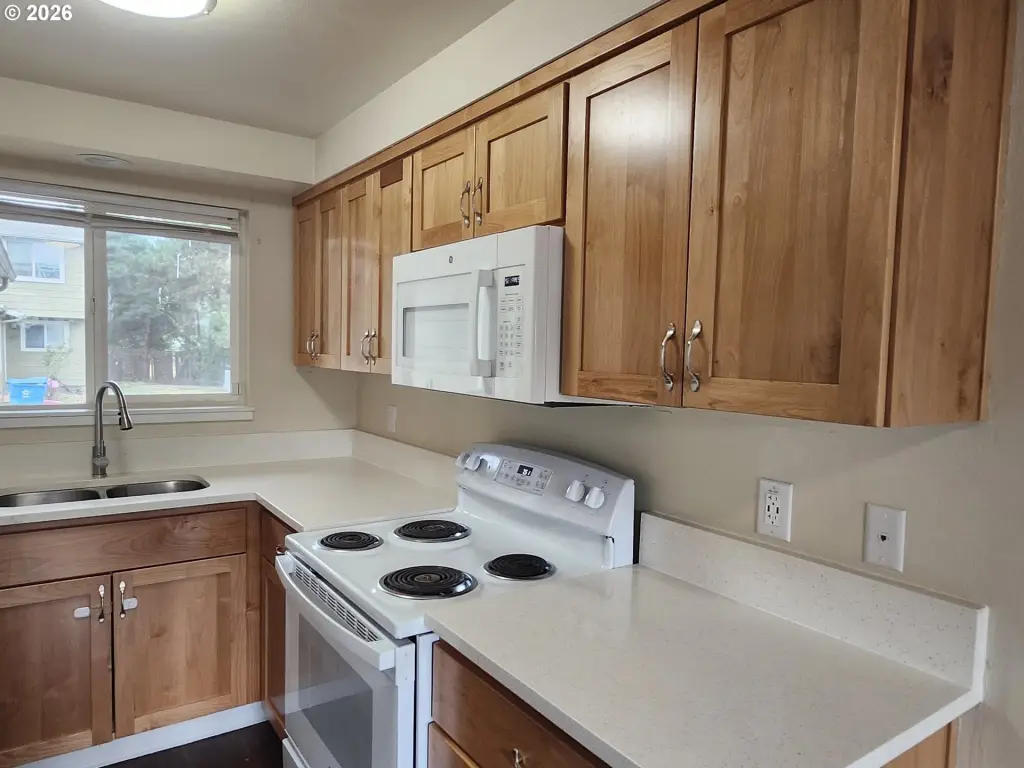
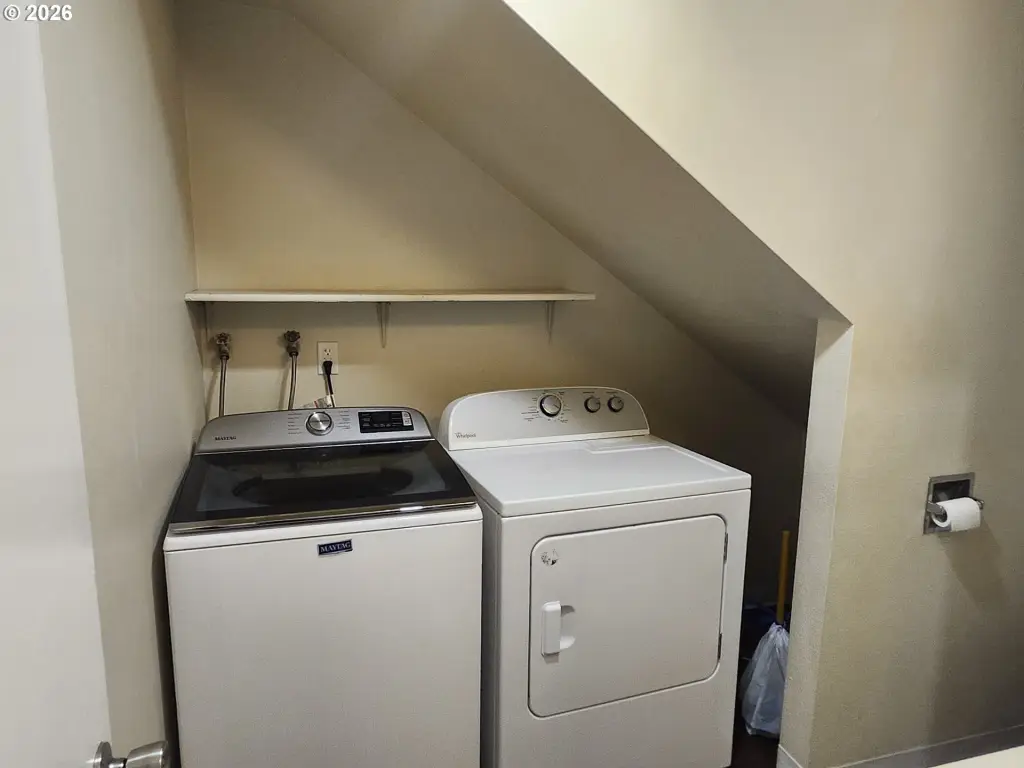
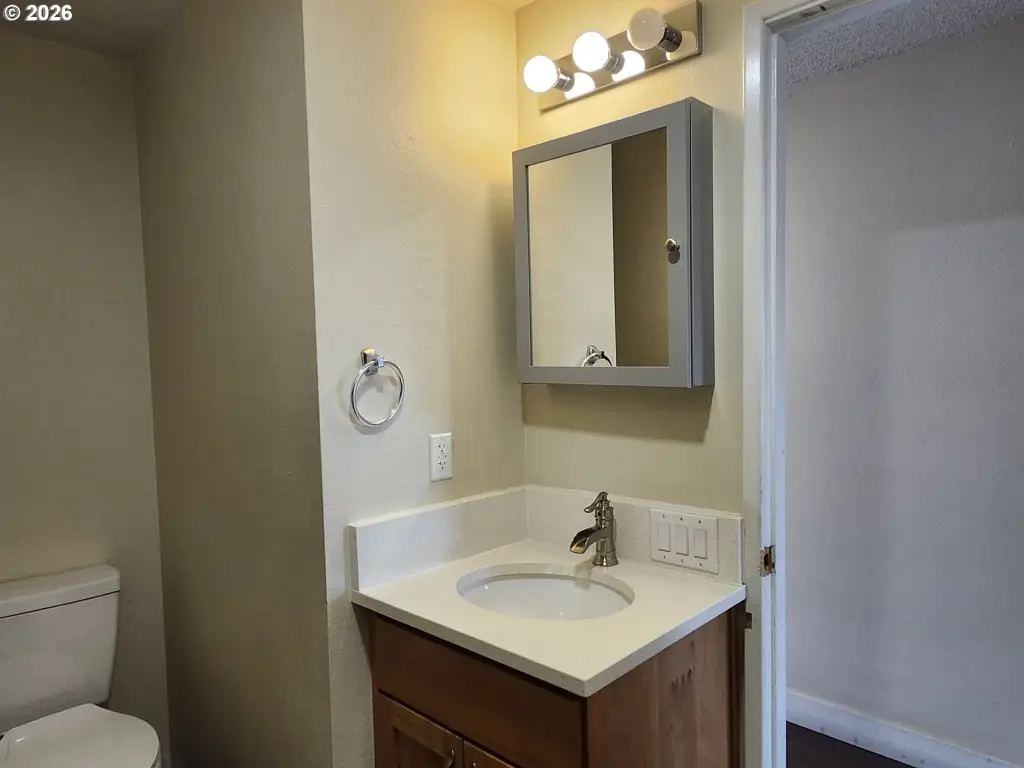
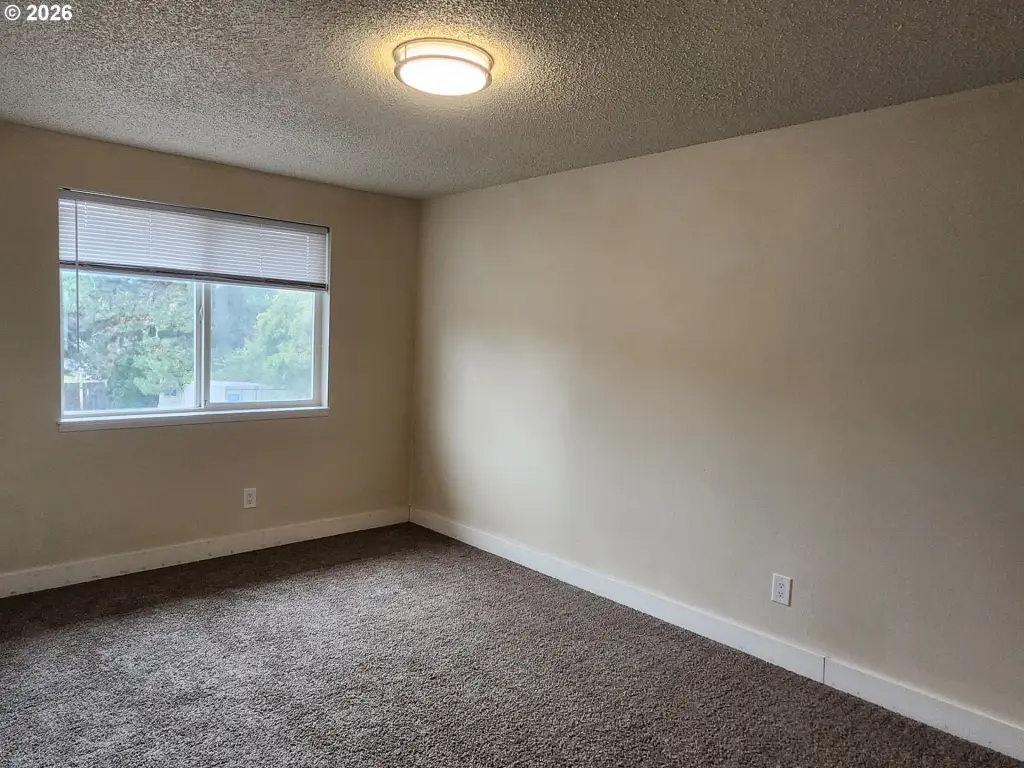
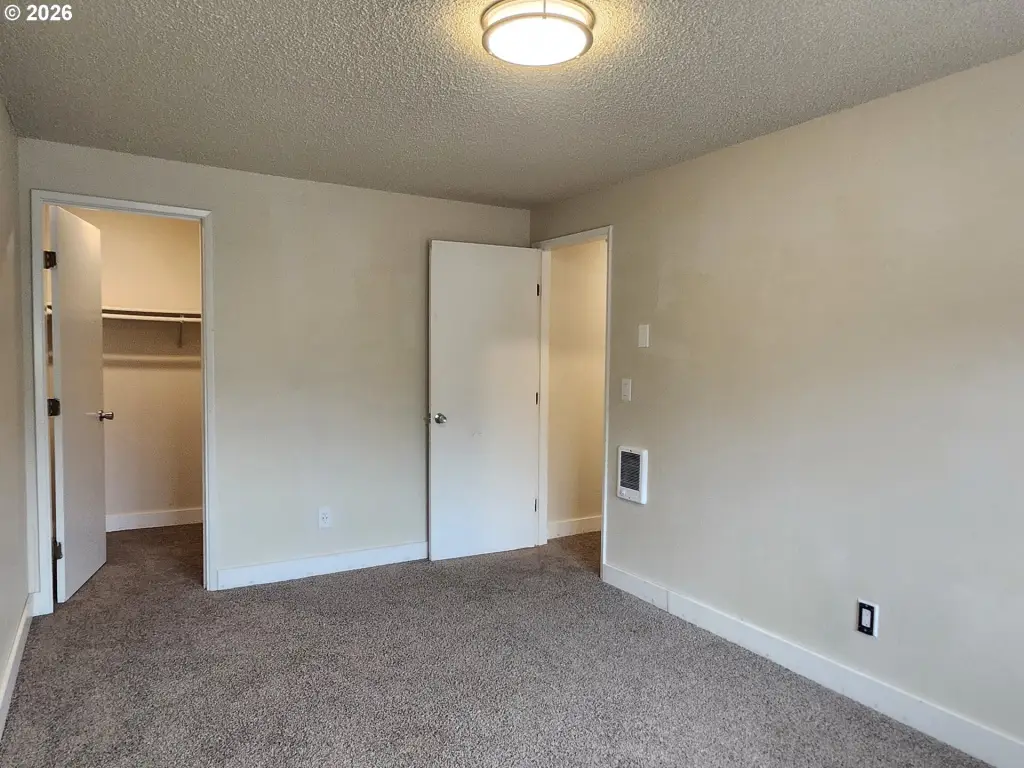
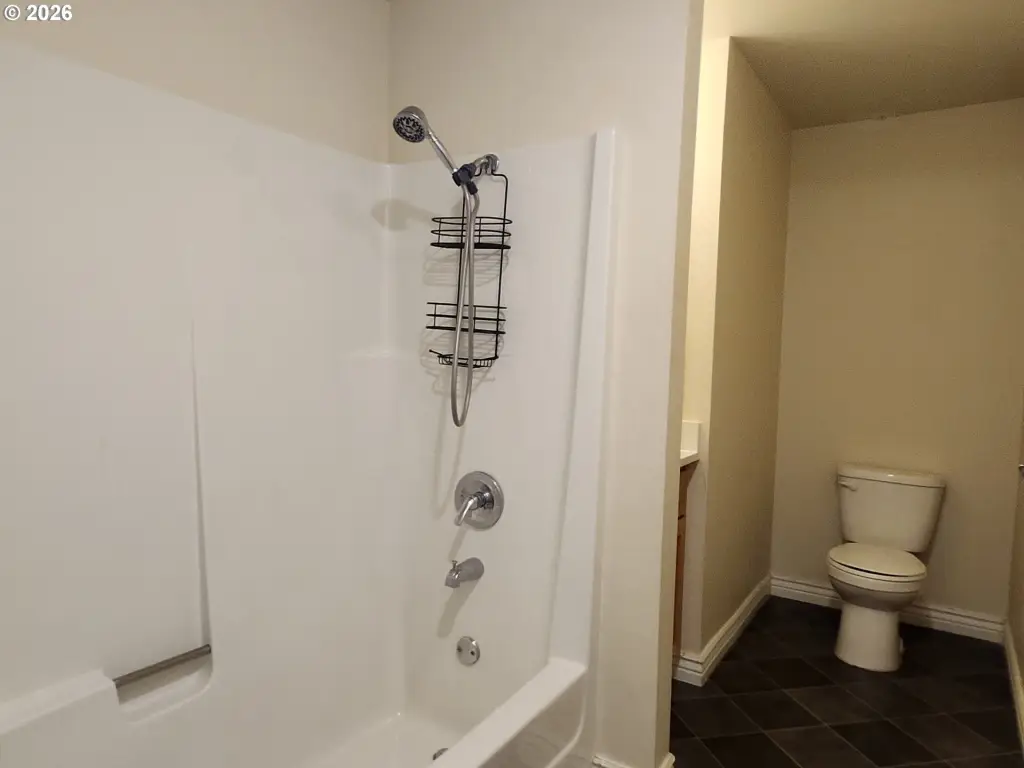
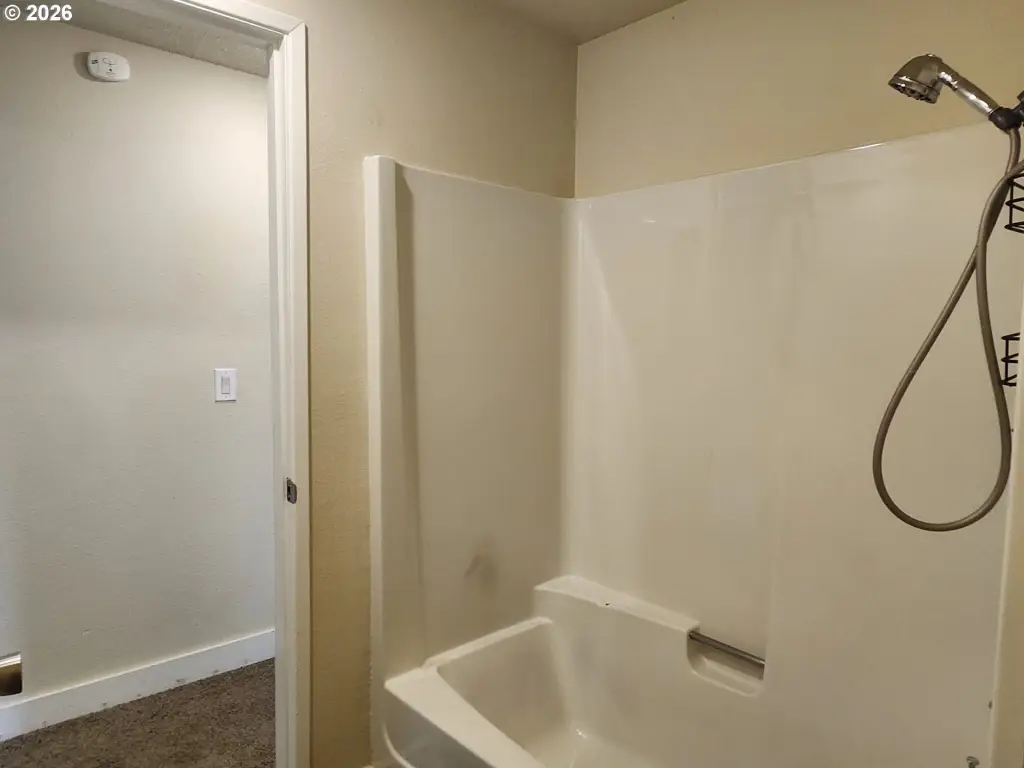
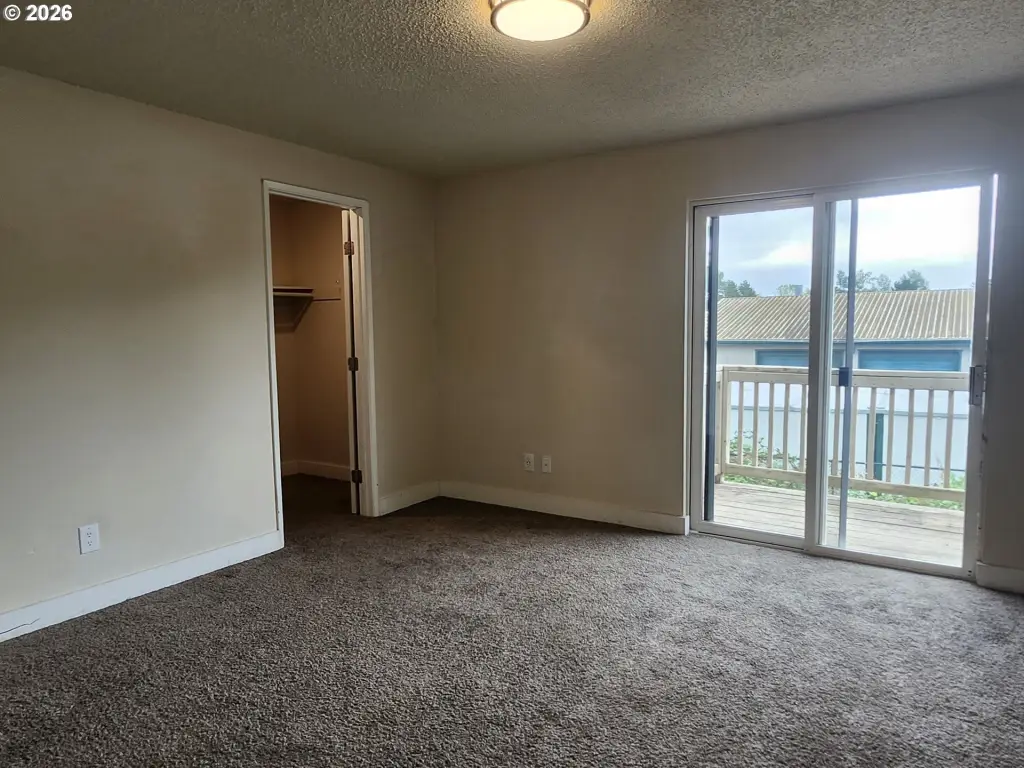
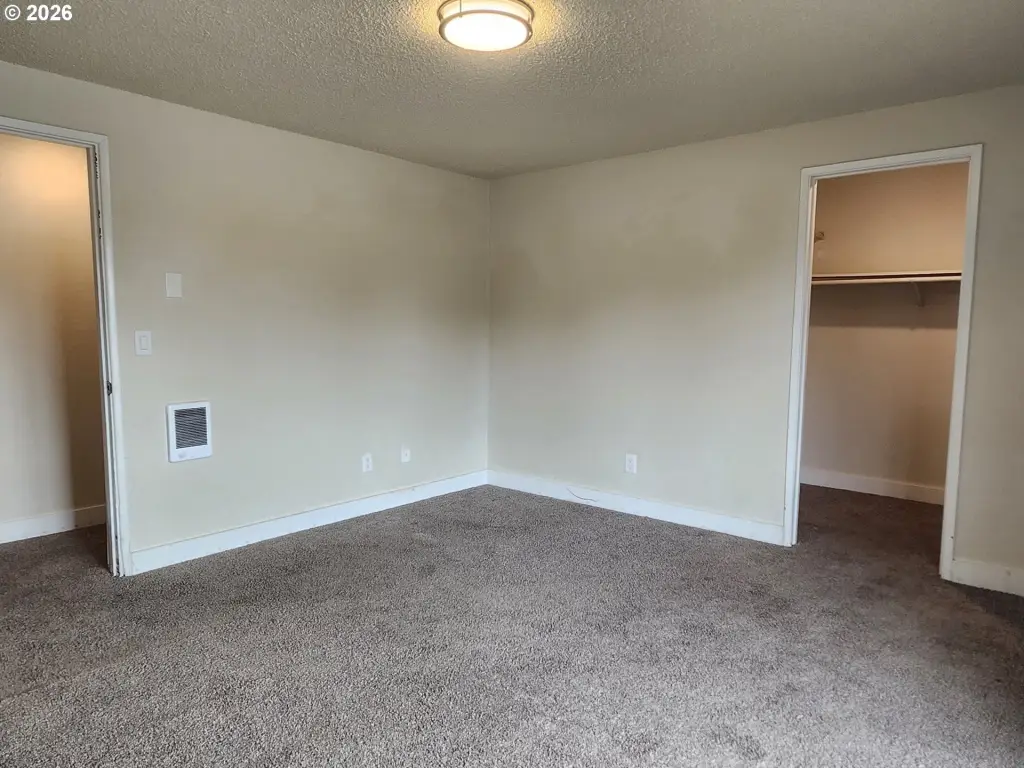
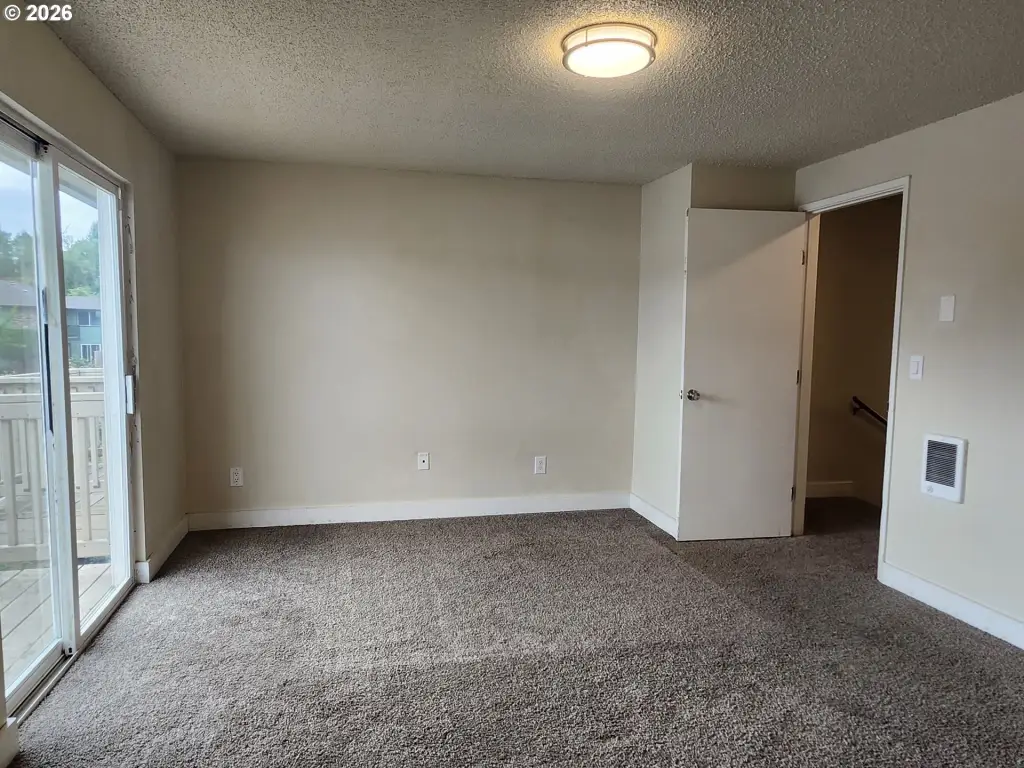
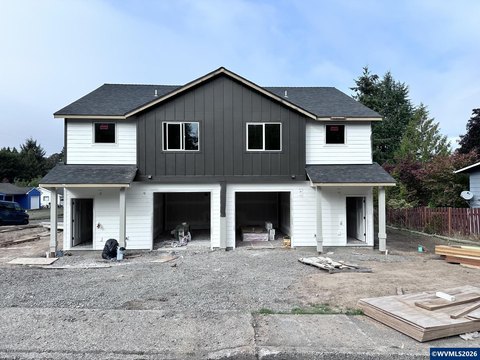
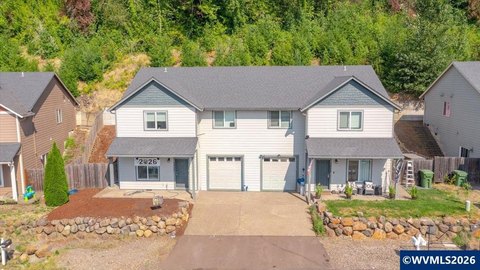
This townhouse-style quadplex contains four well-maintained residences totaling 4,336 square feet. Each unit includes 2 bedrooms, 1.5 bathrooms, washer and dryer hookups, a private deck, and an attached single-car garage. The property also features composition roofing, zoned heating, low-maintenance landscaping, and additional on-site parking. The roof was replaced in 2020, and the building was constructed in 1976.
Set on 0.29 acres along a tree-lined street in South Salem, the property is near Pringle Creek and carries RM2 zoning. Two units are leased below market rent, while the property has a documented rental history and low vacancy.
Set on 0.29 acres along a tree-lined street in South Salem, the property is near Pringle Creek and carries RM2 zoning. Two units are leased below market rent, while the property has a documented rental history and low vacancy.
Key Highlights
- Four‑unit townhouse‑style property with 4,336 square feet
- Each residence has 2 bedrooms and 1.5 bathrooms
- Private deck, laundry hookups, and attached single‑car garage per unit
Financial Insights
Estimated NOI and Cap Rate
NOI / Yr
$52,076
Cap Rate
6.51%
Suggested Prices Based on Cap Rates
Cap Rate 5%
$1,041,520
$1.0M
Cap Rate 7%
$743,943
$743.9K
Cap Rate 9%
$578,622
$578.6K
Market Conditions
NOI Build-Up for 4,336 SF
Gross rent
$79.6K $18.36/SF
− Vacancy
−$5.2K −$1.20/SF
EGI
$74.4K $17.16/SF
− OpEx
−$22.3K −$5.15/SF
NOI
$52.1K $12.01/SF
Area
Salem, OR
Vacancy
6.55%
Lease Rate
$18.36 /SF/Yr
Expense Ratio
30.00%
Simulate Cap Rate and NOI
Suggested Prices Based on Cap Rates
Cap Rate 5%
$1,041,520
Cap Rate 7%
$743,943
Cap Rate 9%
$578,622
Alternative Uses
Best Use
Multifamily LT 5
$743.9K
$651.0K – $867.9K
NOI $52,076 @ 7.0% cap · market cap 6.51%
Second Best
Apartment 5plus
$685.1K
$599.5K – $799.3K
NOI $47,957 @ 7.0% cap · market cap 6.00%
Theoretical Best
Office A
$1.15M
$1.01M – $1.34M
NOI $80,587 @ 7.0% cap · market cap 10.07%
Zoning and permitted uses should be independently verified with authorities.
Property Analytics
Unlock full access to Insights
Subscribe to Realmo Intelligence
Open Analytics
Current Use
Lease Details
4
Residential units
Location Intelligence
Trade Area within ½ mile
651
Businesses Nearby
Explore this area
Business Placement
Demographics for 97302, OR
39,776
Population
17,888
Households
2.2
Avg Household Size
41
Median Age
43%
College-Educated
95%
High-School Grad
23.5 sq mi
ZIP Area
1,693
Density / Sq Mi
$83,697
Median Household Income
$44,623
Median Earnings
$1,230
Median Rent
$415,200
Median Home Value
Check the figures for this property
Cap Rate, Value Estimation, Potential NOI and more
View Realmo Analytics
Market
Vacancy Rate% for Multifamily in West region

Questions? Ask Rey
Realmo’s AI knows this listing — price, zoning, demand, history. Ask anything.





Frequently Asked Questions
What type of property is this?
Quadplex - Four townhouse-style units offer private decks, laundry hookups, and attached garages.
Where is this quadplex located?
The property is located at 1725 SALISHAN St Salem, OR.
What is the asking price?
The asking price for this property is $799,900.
What are key features of this property?
This property features: Four‑unit townhouse‑style property with 4,336 square feet; Each residence has 2 bedrooms and 1.5 bathrooms; Private deck, laundry hookups, and attached single‑car garage per unit


