Downtown Hollywood Commercial
For Sale
$1,399,000
1720 Harrison St # 5A, Hollywood, FL 33020
Multi-tenant commercial condo in Downtown Hollywood with income potential.
Property Size2,960 SF
Price / SF$559.60
Days on Market148
Property Features for 1720 Harrison St # 5A
General Information
Standard status
Active
Size
2,960 SF
Property subtype
Retail
Taxes and HOA fees
Annual Taxes
$10,869
Building Details
Building Size
2,960 SF
Year Built
1963
Listing Agency:
RE/MAX 5 Star Realty
Listed By:
John DeMarco · License #3134747
(954) 453-1000
Source:
Relinkre
Added: May 18
Changed: Oct 7
Last Checked: Oct 11 at 1:43PM
Displayed information is deemed reliable but is not guaranteed and should be independently verified. All listing content including descriptions, pricing, images are the copyrighted material of RE/MAX 5 Star Realty
Investment Insights
Based on property information with market context.
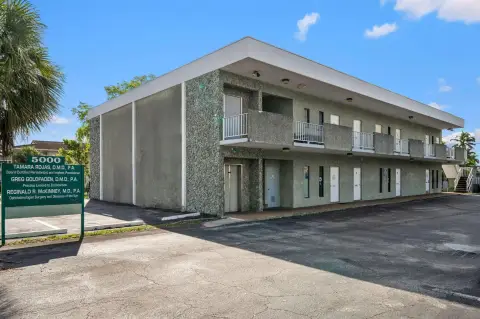
This multi-tenant commercial condominium is located in Downtown Hollywood. The property is currently configured into seven separate office suites with existing rental income. Previously operated as a restaurant with an approximately 2,500-square-foot outdoor rooftop terrace, the property offers an opportunity for an owner-user, investor, restaurant operator, creative office user, or hospitality concept seeking flexible space. The property is positioned on the same floor as the building’s amenity deck, which includes the pool, fitness center, mail room, and common restrooms. The property presents a hospitality-style environment with future repositioning and rental upside potential. The location has a bike score of 69, indicating it is bikeable, a walk score of 67, indicating it is somewhat walkable, and a transit score of 41, indicating some transit options are available.
Key Highlights
- Multi‑tenant commercial condominium with existing rental income.
- Located in the heart of Downtown Hollywood.
- Enjoy a ±2,500 SF outdoor rooftop terrace (previously a restaurant).**
Financial Insights
Estimated NOI and Cap Rate
NOI / Yr
$48,263
Cap Rate
3.45%
Suggested Prices Based on Cap Rates
Cap Rate 5%
$965,260
$965.3K
Cap Rate 7%
$689,471
$689.5K
Cap Rate 9%
$536,256
$536.3K
Market Conditions
NOI Build-Up for 2,500 SF
Gross rent
$82.5K $33.00/SF
− Vacancy
−$18.2K −$7.26/SF
EGI
$64.4K $25.74/SF
− OpEx
−$16.1K −$6.44/SF
NOI
$48.3K $19.31/SF
Area
Hollywood, FL
Vacancy
22.00%
Lease Rate
$33.00 /SF/Yr
Expense Ratio
25.00%
Simulate Cap Rate and NOI
Suggested Prices Based on Cap Rates
Cap Rate 5%
$965,260
Cap Rate 7%
$689,471
Cap Rate 9%
$536,256
Alternative Uses
Best Use
Office B
$689.5K
$603.3K – $804.4K
NOI $48,263 @ 7.0% cap · market cap 3.45%
Second Best
—
—
no second resolved use
Theoretical Best
Office A
$978.0K
$855.8K – $1.14M
NOI $68,460 @ 7.0% cap · market cap 4.89%
Zoning and permitted uses should be independently verified with authorities.
How Realmo checks its estimates
Property Analytics
Unlock full access to Insights
Subscribe to Realmo Intelligence
Open Analytics
Current Use
Location Intelligence
Trade Area within ½ mile
3,242
Businesses Nearby
Explore this area
Business Placement
Demographics for 33020, FL
45,044
Population
22,508
Households
2
Avg Household Size
41
Median Age
29%
College-Educated
89%
High-School Grad
6.0 sq mi
ZIP Area
7,507
Density / Sq Mi
$52,535
Median Household Income
$32,449
Median Earnings
$1,444
Median Rent
$306,700
Median Home Value
Check the figures for this property
Cap Rate, Value Estimation, Potential NOI and more
View Realmo Analytics
Market
Vacancy Rate% for Office in South region

Questions? Ask Rey
Realmo’s AI knows this listing — price, zoning, demand, history. Ask anything.




Frequently Asked Questions
What type of property is this?
Office units - Multi-tenant commercial condo in Downtown Hollywood with income potential.
Where is this office units located?
The property is located at 1720 Harrison St # 5A Hollywood, FL.
What is the asking price?
The asking price for this property is $1,399,000.
What are key features of this property?
This property features: Multi‑tenant commercial condominium with existing rental income.; Located in the heart of Downtown Hollywood.; Enjoy a ±2,500 SF outdoor rooftop terrace (previously a restaurant).**


