Three-Building Mixed-Use
For Sale
$1,350,000
1719 1719-23 Delaware Ave, Wilmington, DE 19806
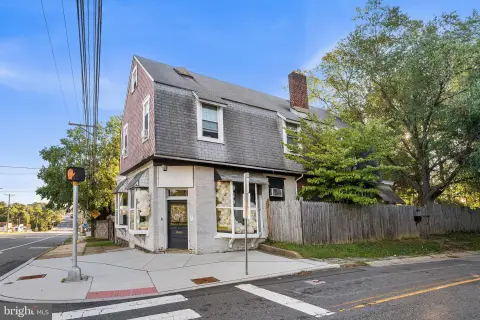
Office, retail, salon, and residential components are paired with on-site parking in an urban Wilmington setting.
Property Size11,376 SF
Price / SF$118.67
Days on Market69
Property Features for 1719 1719-23 Delaware Ave
General Information
Standard status
Active
Size
11,376 SF
Building Details
Year Built
1986
Buildings
3
Tenancy
Multi
Listing Agency:
Pantano Real Estate Inc
Listed By:
Paul M Pantano · License #RB-0002776
(302) 888-0300
Source:
Kableteam
Added: Aug 7
Changed: Oct 11
Last Checked: Oct 5 at 9:00PM
Displayed information is deemed reliable but is not guaranteed and should be independently verified. All listing content including descriptions, pricing, images are the copyrighted material of Pantano Real Estate Inc
Investment Insights
Based on property information with market context.
This mixed-use assemblage comprises three buildings totaling 11,376 square feet. The 1986 property includes a newer purpose-built office structure at 1719 Delaware Avenue with four levels of workspace, including a lower level. Additional buildings at 1721 and 1732 Delaware Avenue contain retail tenancy, salon space, and a residential dwelling unit, providing a range of established commercial and residential components within one offering.
The property includes on-site parking and additional off-site parking nearby. It is situated in Wilmington’s Trolley Square/Forty Acres district and falls within the Forty Acres Neighborhood Conservation District, a designation by the City of Wilmington. The Delaware Avenue address places the assemblage within an established urban neighborhood with multiple use types represented across the buildings.
The property includes on-site parking and additional off-site parking nearby. It is situated in Wilmington’s Trolley Square/Forty Acres district and falls within the Forty Acres Neighborhood Conservation District, a designation by the City of Wilmington. The Delaware Avenue address places the assemblage within an established urban neighborhood with multiple use types represented across the buildings.
Key Highlights
- Three‑building assemblage totaling 11,376 SF
- 1986 construction with a four‑level office building, including a lower level
- Retail tenancy, salon space, and a residential dwelling unit across the assemblage
Financial Insights
Estimated NOI and Cap Rate
NOI / Yr
$115,933
Cap Rate
8.59%
Suggested Prices Based on Cap Rates
Cap Rate 5%
$2,318,660
$2.3M
Cap Rate 7%
$1,656,186
$1.7M
Cap Rate 9%
$1,288,144
$1.3M
Market Conditions
NOI Build-Up for 11,376 SF
Gross rent
$215.7K $18.96/SF
− Vacancy
−$30.2K −$2.65/SF
EGI
$185.5K $16.31/SF
− OpEx
−$69.6K −$6.11/SF
NOI
$115.9K $10.19/SF
Area
New Castle County, DE
Vacancy
14.00%
Lease Rate
$18.96 /SF/Yr
Expense Ratio
37.50%
Simulate Cap Rate and NOI
Suggested Prices Based on Cap Rates
Cap Rate 5%
$2,318,660
Cap Rate 7%
$1,656,186
Cap Rate 9%
$1,288,144
Alternative Uses
Best Use
Office B
$2.21M
$1.94M – $2.58M
NOI $154,948 @ 7.0% cap · market cap 11.48%
Second Best
Mixed Use
$1.66M
$1.45M – $1.93M
NOI $115,933 @ 7.0% cap · market cap 8.59%
Theoretical Best
Office A
$2.72M
$2.38M – $3.17M
NOI $190,472 @ 7.0% cap · market cap 14.11%
Zoning and permitted uses should be independently verified with authorities.
How Realmo checks its estimates
Property Analytics
Unlock full access to Insights
Subscribe to Realmo Intelligence
Open Analytics
Current Use
Lease Details
Multi-tenant
Tenancy
Location Intelligence
Trade Area within ½ mile
2,457
Businesses Nearby
Explore this area
Business Placement
Demographics for 19806, DE
10,083
Population
6,638
Households
1.5
Avg Household Size
45
Median Age
71%
College-Educated
98%
High-School Grad
1.7 sq mi
ZIP Area
5,931
Density / Sq Mi
$86,240
Median Household Income
$76,246
Median Earnings
$1,329
Median Rent
$370,500
Median Home Value
Check the figures for this property
Cap Rate, Value Estimation, Potential NOI and more
View Realmo Analytics
Market
Vacancy Rate% for Office in South region

Questions? Ask Rey
Realmo’s AI knows this listing — price, zoning, demand, history. Ask anything.




Frequently Asked Questions
What type of property is this?
Mixed-use property - Office, retail, salon, and residential components are paired with on-site parking in an urban Wilmington setting.
Where is this mixed-use property located?
The property is located at 1719 1719-23 Delaware Ave Wilmington, DE.
What is the asking price?
The asking price for this property is $1,350,000.
What are key features of this property?
This property features: Three‑building assemblage totaling 11,376 SF; 1986 construction with a four‑level office building, including a lower level; Retail tenancy, salon space, and a residential dwelling unit across the assemblage


