Furnished 2-Bedroom Income
For Sale
$570,000
1709 N ROUTE 35 #9 SEASIDE, Seaside Heights, NJ 08751
Turnkey coastal residence with two private balconies, in-unit laundry, and parking for two vehicles.
Property Size1,386 SF
Days on Market277
Property Features for 1709 N ROUTE 35 #9 SEASIDE
General Information
Standard status
Active
Size
1,386 SF
Property subtype
Apartment
Amenities
Central A/C
Forced Air
Microwave
Refrigerator
Oven/Range - Gas
Exhaust Fan
Washer/Dryer Stacked
Patio, Shingle
Building Details
Building Size
1,386 SF
Year Built
1992
Listing Agency:
Westfield
Listed By:
Carlo Flores · License #1007573
(908) 294-1421
Source:
Kw
Added: Jan 22
Changed: Oct 26
Last Checked: Oct 24 at 9:04PM
Displayed information is deemed reliable but is not guaranteed and should be independently verified. All listing content including descriptions, pricing, images are the copyrighted material of Westfield

Ask AI about this property
Review the available facts, identify missing information and prepare questions for the agent.
Investment Insights
Based on property information with market context.
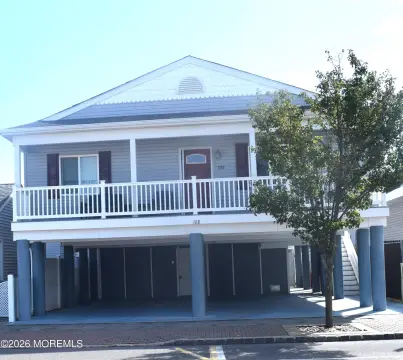
This renovated two-bedroom residential income property in Pirates Cove at Ortley Beach is offered fully furnished. The interior includes connected living and dining areas, a modern kitchen with stone countertops and cabinetry, and a refreshed bathroom with high ceilings and natural light. Coastal-friendly flooring, updated lighting, central A/C, forced air, and a stacked washer and dryer add practical functionality. The home also provides a front porch, two private balconies, and access to a shared courtyard.
The property is about a block from the ocean and close to the Seaside Heights Boardwalk, local dining, Seaside Bridge, Barnegat Bay, water sports, and marinas. Parking accommodates two vehicles, pets are welcome, and no rental restrictions are stated for the community. Built in 1992, the residence combines furnished occupancy with a shore-oriented setting.
The property is about a block from the ocean and close to the Seaside Heights Boardwalk, local dining, Seaside Bridge, Barnegat Bay, water sports, and marinas. Parking accommodates two vehicles, pets are welcome, and no rental restrictions are stated for the community. Built in 1992, the residence combines furnished occupancy with a shore-oriented setting.
Key Highlights
- Renovated two‑bedroom residence offered fully furnished
- About a block from the ocean in Pirates Cove at Ortley Beach
- Two private balconies, front porch, and shared courtyard access
Financial Insights
Estimated NOI and Cap Rate
NOI / Yr
$21,314
Cap Rate
3.74%
Suggested Prices Based on Cap Rates
Cap Rate 5%
$426,280
$426.3K
Cap Rate 7%
$304,486
$304.5K
Cap Rate 9%
$236,822
$236.8K
Market Conditions
NOI Build-Up for 1,386 SF
Gross rent
$41.6K $30.00/SF
− Vacancy
−$2.8K −$2.04/SF
EGI
$38.8K $27.96/SF
− OpEx
−$17.4K −$12.58/SF
NOI
$21.3K $15.38/SF
Area
Ocean County, NJ
Vacancy
6.80%
Lease Rate
$30.00 /SF/Yr
Expense Ratio
45.00%
Simulate Cap Rate and NOI
Suggested Prices Based on Cap Rates
Cap Rate 5%
$426,280
Cap Rate 7%
$304,486
Cap Rate 9%
$236,822
Alternative Uses
Best Use
Apartment 5plus
$304.5K
$266.4K – $355.2K
NOI $21,314 @ 7.0% cap · market cap 3.74%
Second Best
—
—
no second resolved use
Theoretical Best
Office A
$361.9K
$316.7K – $422.2K
NOI $25,334 @ 7.0% cap · market cap 4.44%
Zoning and permitted uses should be independently verified with authorities.
How Realmo checks its estimates
Location Intelligence
Trade Area within ½ mile
532
Businesses Nearby
Explore this area
Business Placement
Demographics for 08751, NJ
3,867
Population
5,319
Households
0.7
Avg Household Size
48
Median Age
39%
College-Educated
90%
High-School Grad
1.3 sq mi
ZIP Area
2,975
Density / Sq Mi
$75,000
Median Household Income
$52,273
Median Earnings
$1,437
Median Rent
$583,000
Median Home Value

Frequently Asked Questions
What type of property is this?
Residential income property - Turnkey coastal residence with two private balconies, in-unit laundry, and parking for two vehicles.
Where is this residential income property located?
The property is located at 1709 N ROUTE 35 #9 SEASIDE Seaside Heights, NJ.
What is the asking price?
The asking price for this property is $570,000.
What are key features of this property?
This property features: Renovated two‑bedroom residence offered fully furnished; About a block from the ocean in Pirates Cove at Ortley Beach; Two private balconies, front porch, and shared courtyard access



