Three-Story Brick Apartment
For Sale
$419,000
1703 S 4th St, Louisville, KY 40208
Historic full-brick property with updated apartments, retained appliances, and proximity to the University of Louisville.
Property Size4,323 SF
Price / SF$96.92
Days on Market52
Property Features for 1703 S 4th St
General Information
Standard status
Active
Size
4,323 SF
Property subtype
Multi-Family
Units
Unit Mix
6 x 1BR, 1 x 2BR, 2 x efficiency
Multifamily Units
8
Building Details
Year Built
1900
Buildings
1
Stories
3
Construction
brick
Listing Agency:
Demaree & Hubbard
Listed By:
Key Associates Signature Realty
(812) 686-3268
Source:
Keyassociates
Added: Sep 1
Changed: Oct 21
Last Checked: Oct 20 at 8:19PM
Displayed information is deemed reliable but is not guaranteed and should be independently verified. All listing content including descriptions, pricing, images are the copyrighted material of Demaree & Hubbard

Ask AI about this property
Review the available facts, identify missing information and prepare questions for the agent.
Investment Insights
Based on property information with market context.
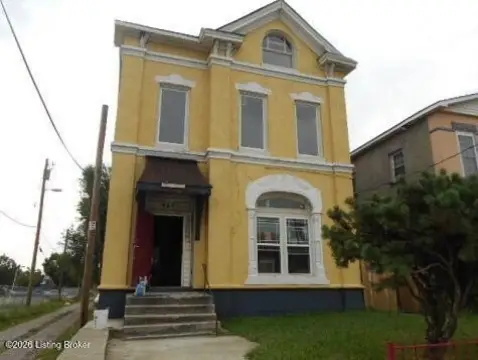
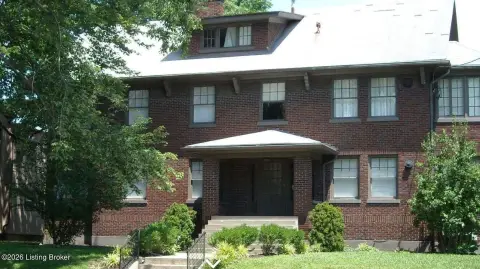
Built in 1900, this 4,323-square-foot, three-story apartment property occupies a full-brick Victorian-era structure. The building features original brass hardware, copper gutters, a copper porch roof, chimney details, and architectural exterior stonework. A new roof has been installed, while apartment interiors include a mix of completed updates and ongoing renovation work. Appliances remain with the units.
The property is located at 1703 S 4th St, two blocks from the University of Louisville. Louisville International Airport, downtown Louisville, St. James Court, and major shopping centers are each approximately 10 minutes away.
The property is located at 1703 S 4th St, two blocks from the University of Louisville. Louisville International Airport, downtown Louisville, St. James Court, and major shopping centers are each approximately 10 minutes away.
Key Highlights
- 4,323‑square‑foot apartment property built in 1900
- Three‑story full‑brick Victorian‑era structure
- Two blocks from the University of Louisville
Financial Insights
Estimated NOI and Cap Rate
NOI / Yr
$29,420
Cap Rate
7.02%
Suggested Prices Based on Cap Rates
Cap Rate 5%
$588,400
$588.4K
Cap Rate 7%
$420,286
$420.3K
Cap Rate 9%
$326,889
$326.9K
Market Conditions
NOI Build-Up for 4,323 SF
Gross rent
$56.5K $13.08/SF
− Vacancy
−$3.1K −$0.71/SF
EGI
$53.5K $12.37/SF
− OpEx
−$24.1K −$5.57/SF
NOI
$29.4K $6.81/SF
Area
Louisville, KY
Vacancy
5.40%
Lease Rate
$13.08 /SF/Yr
Expense Ratio
45.00%
Simulate Cap Rate and NOI
Suggested Prices Based on Cap Rates
Cap Rate 5%
$588,400
Cap Rate 7%
$420,286
Cap Rate 9%
$326,889
Alternative Uses
Best Use
Apartment 5plus
$420.3K
$367.8K – $490.3K
NOI $29,420 @ 7.0% cap · market cap 7.02%
Second Best
—
—
no second resolved use
Theoretical Best
Office A
$1.12M
$980.5K – $1.31M
NOI $78,437 @ 7.0% cap · market cap 18.72%
Zoning and permitted uses should be independently verified with authorities.
How Realmo checks its estimates
Property Analytics
Contact the owner directly
Get the owner's phone numbers and email
Open Analytics
Lease Details
8
Residential units
Location Intelligence
Trade Area within ½ mile
904
Businesses Nearby
Explore this area
Business Placement
Demographics for 40208, KY
17,048
Population
6,675
Households
2.6
Avg Household Size
27
Median Age
34%
College-Educated
88%
High-School Grad
2.6 sq mi
ZIP Area
6,557
Density / Sq Mi
$37,714
Median Household Income
$17,255
Median Earnings
$914
Median Rent
$153,100
Median Home Value
Check the figures for this property
Cap Rate, Value Estimation, Potential NOI and more
View Realmo Analytics
Market
Vacancy Rate% for Multifamily in South region





Frequently Asked Questions
What type of property is this?
Apartment building - Historic full-brick property with updated apartments, retained appliances, and proximity to the University of Louisville.
Where is this apartment building located?
The property is located at 1703 S 4th St Louisville, KY.
What is the asking price?
The asking price for this property is $419,000.
What are key features of this property?
This property features: 4,323‑square‑foot apartment property built in 1900; Three‑story full‑brick Victorian‑era structure; Two blocks from the University of Louisville


