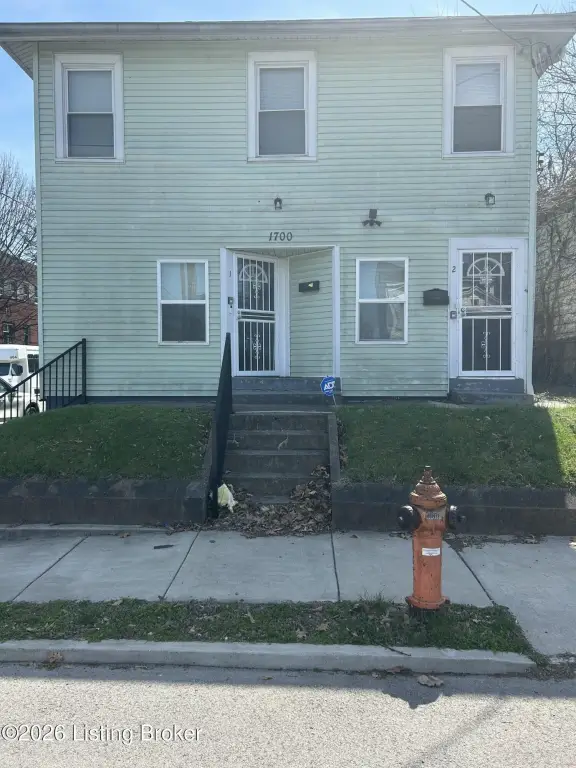
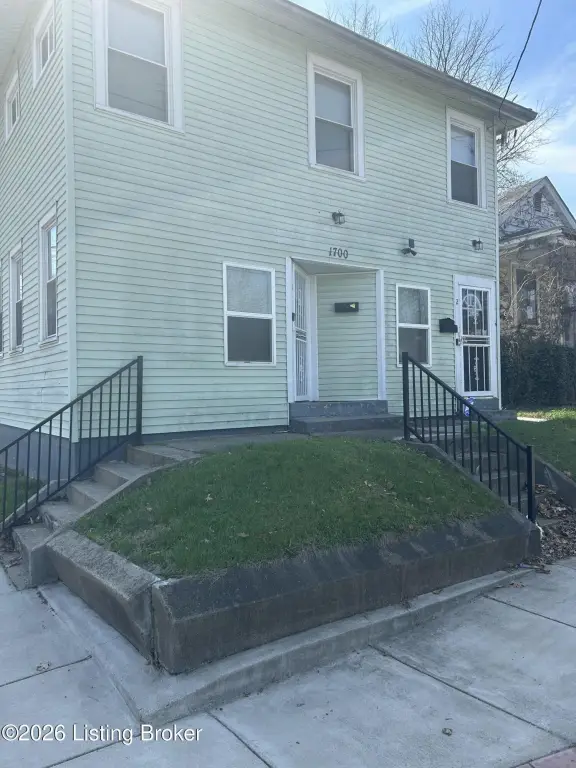
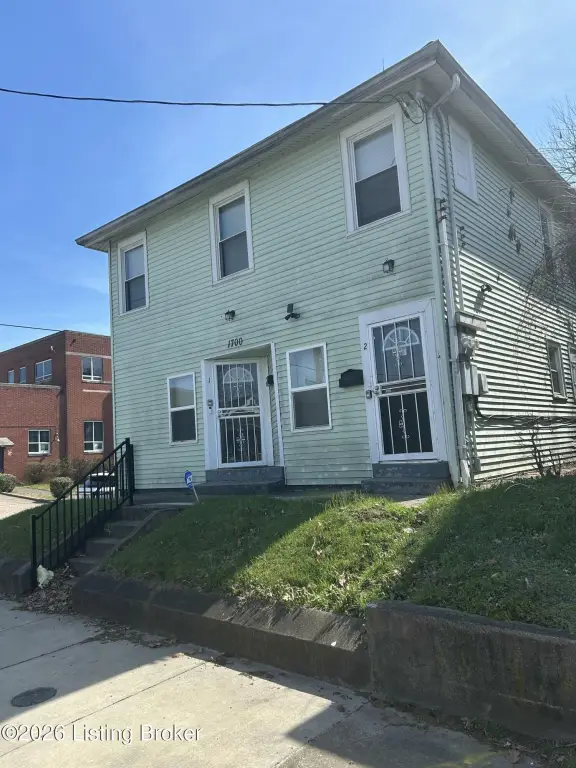
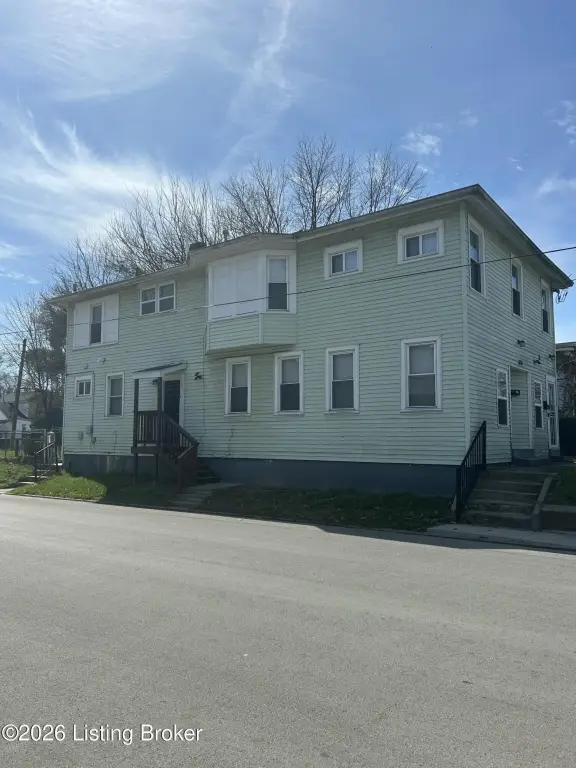
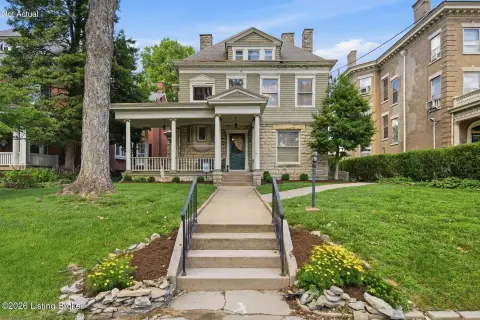
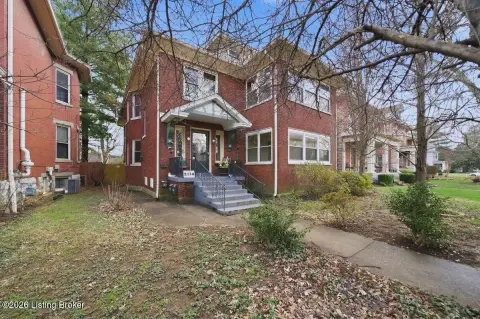
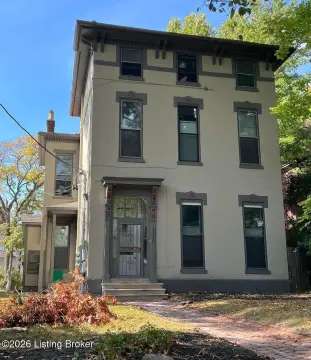
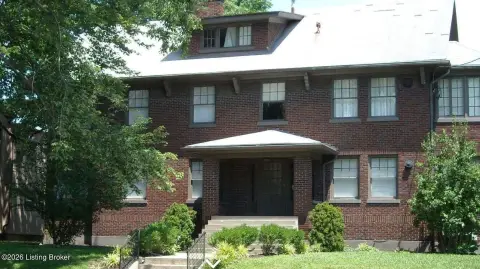
Duplex With Two Four-Bed
1700 Bolling Ave Louisville, KY 40210
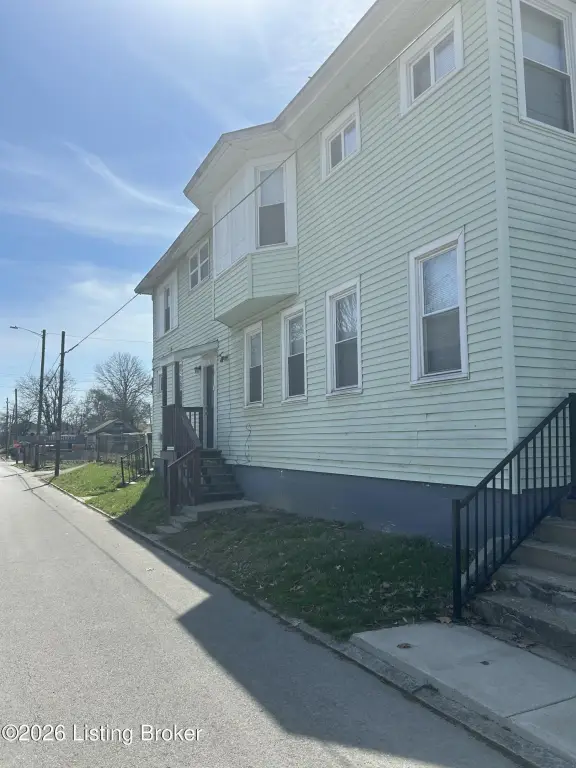
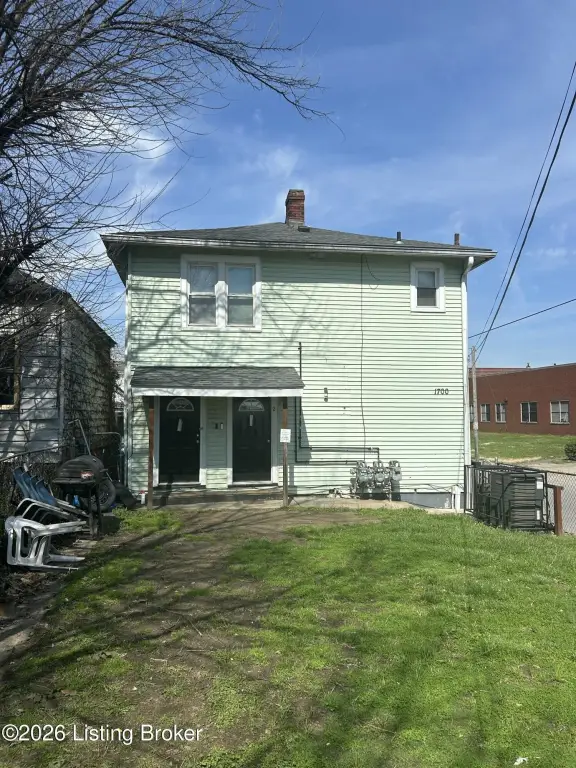
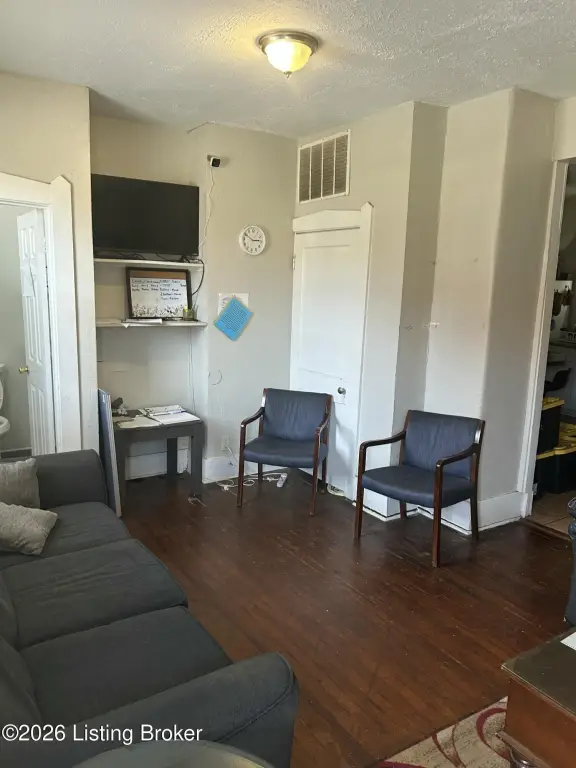
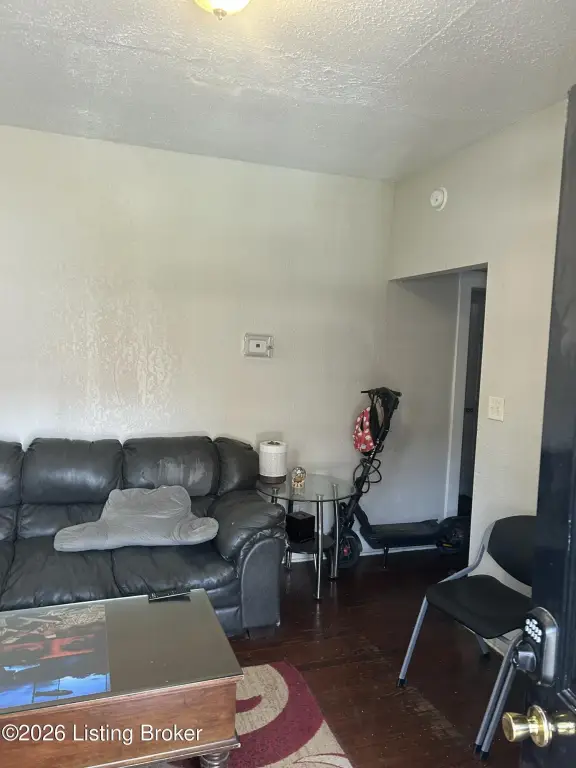
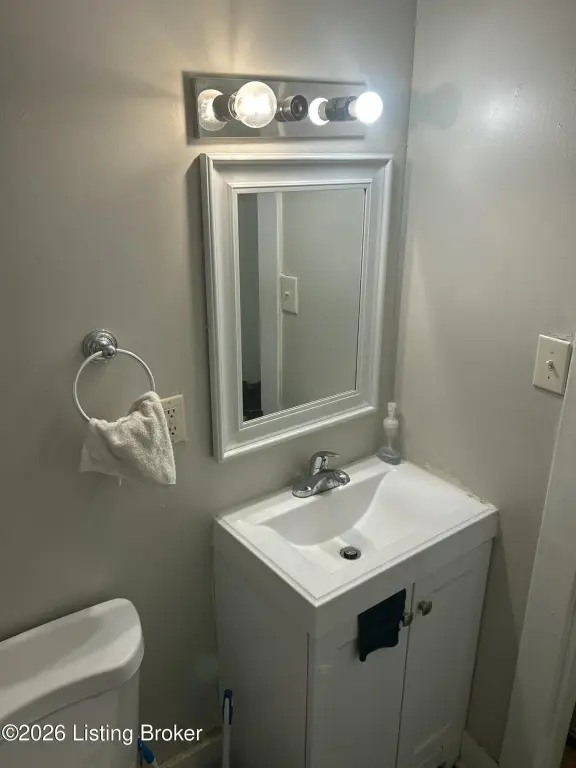
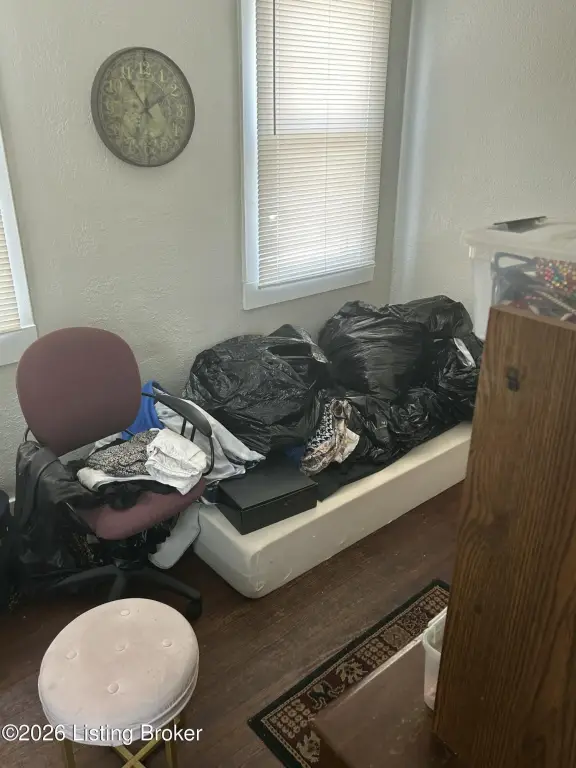
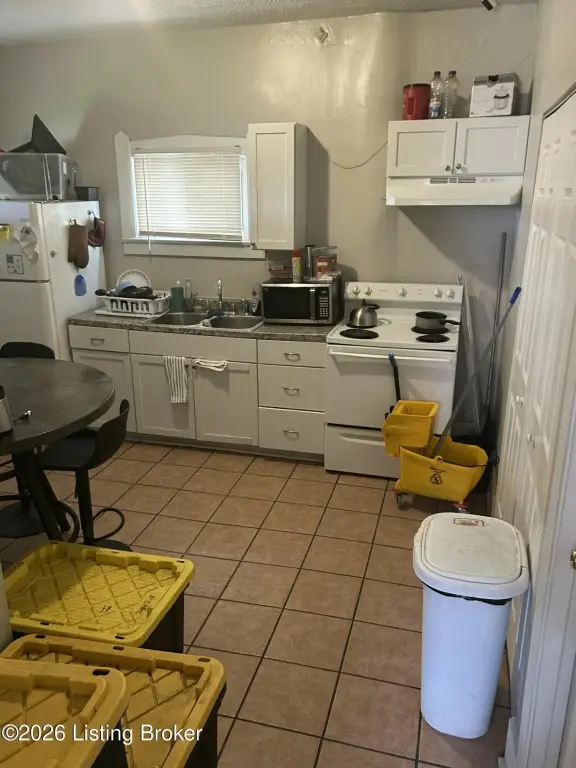
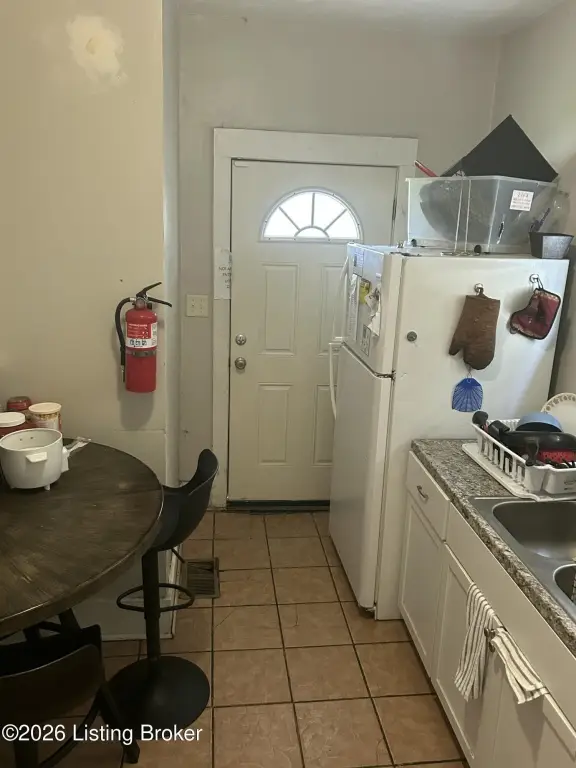
For Sale
$190,000
MULTI_FAMILY - Other - Louisville, KY
Property Size2,563 SF
Price / SF$74.13
Days on Market48
Property Features for 1700 Bolling Ave
General Information
Property type
Residential Multi Family
Property subtype
Duplex
Bedrooms
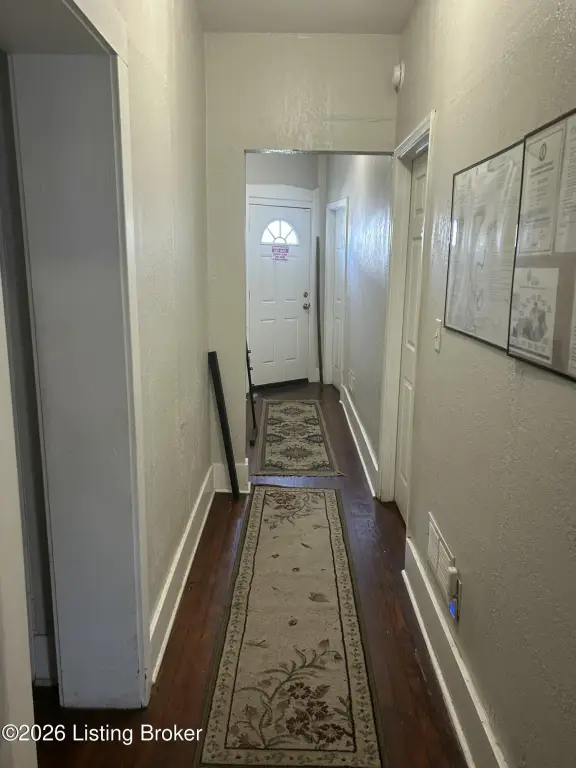
8
Bathrooms
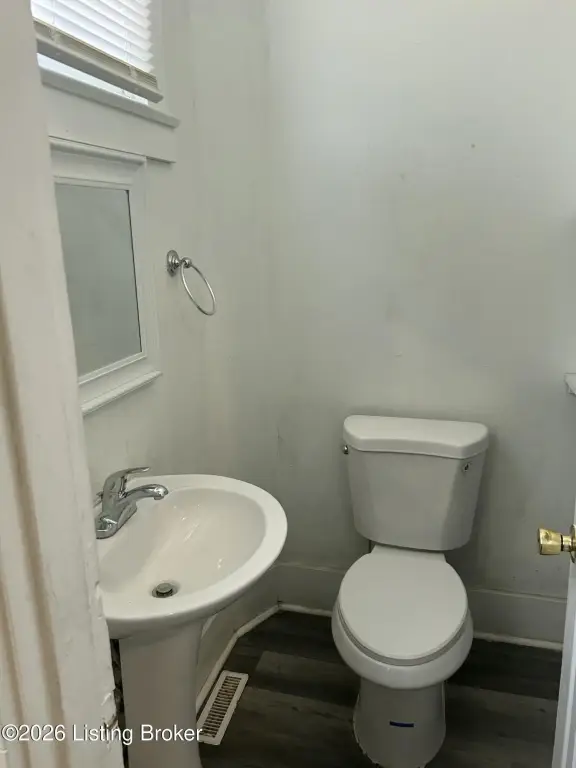
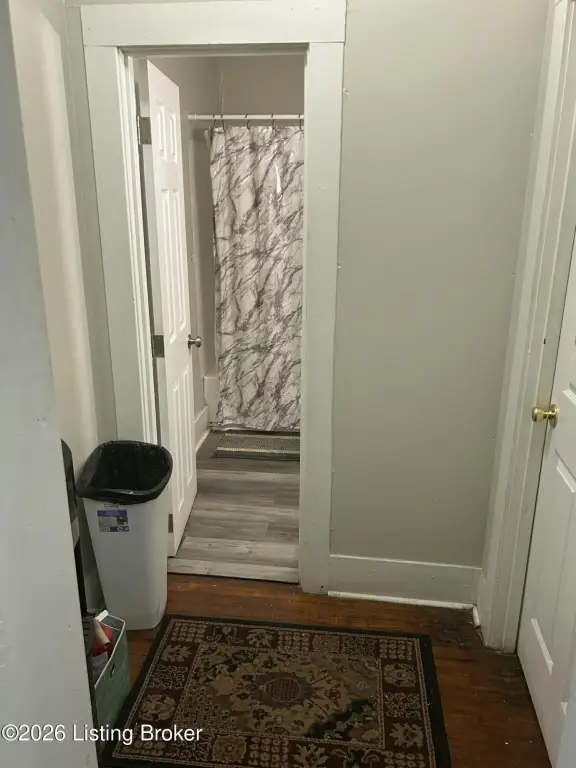
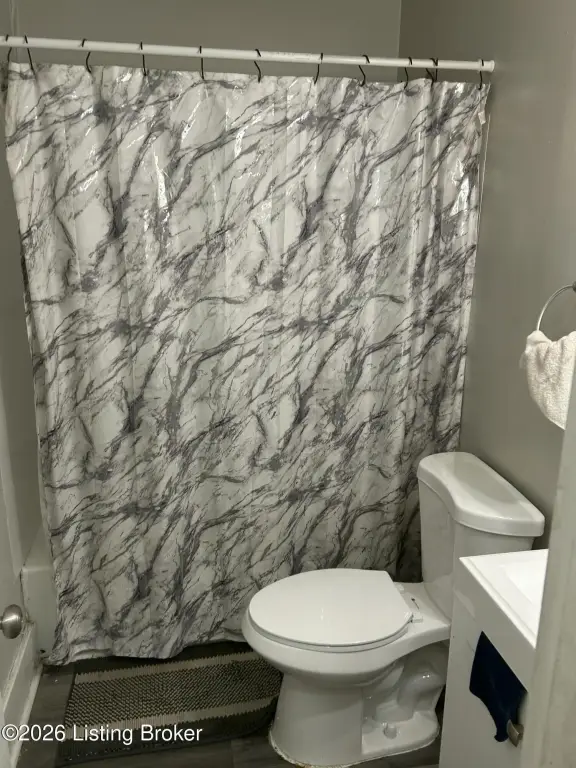
4
Rooms
Bedroom 1, Bedroom 4, Bedroom 6, Bathroom 4, Bathroom 2, Bathroom 1, Bedroom 2, Bedroom 8, Bedroom 5, Bathroom 3, Bedroom 7, Bedroom 3
Standard status
Active
APN
039F01140000
Size
2,563 SF
Utilities
Sewer type
Public Sewer
Cooling system
Central Air
Water source
Public
Building Details
Year built
1920
Number of units
2
Building materials
Vinyl Siding
Roof type
Shingle
Architectural style
Other
Listing Agency:
Covenant Realty LLC
(502) 797-4761
Listed By:
Linda Green
(502) 931-9749
Added: Jun 11
Changed: Jul 25
Last Checked: Jul 28 at 7:06AM
MLS# 1720189
Copyright © 2026 Greater Louisville Association of REALTORS®. All rights reserved. All information provided by the listing agent/broker is deemed reliable but is not guaranteed and should be independently verified.
Investment Insights
Based on property information with market context.
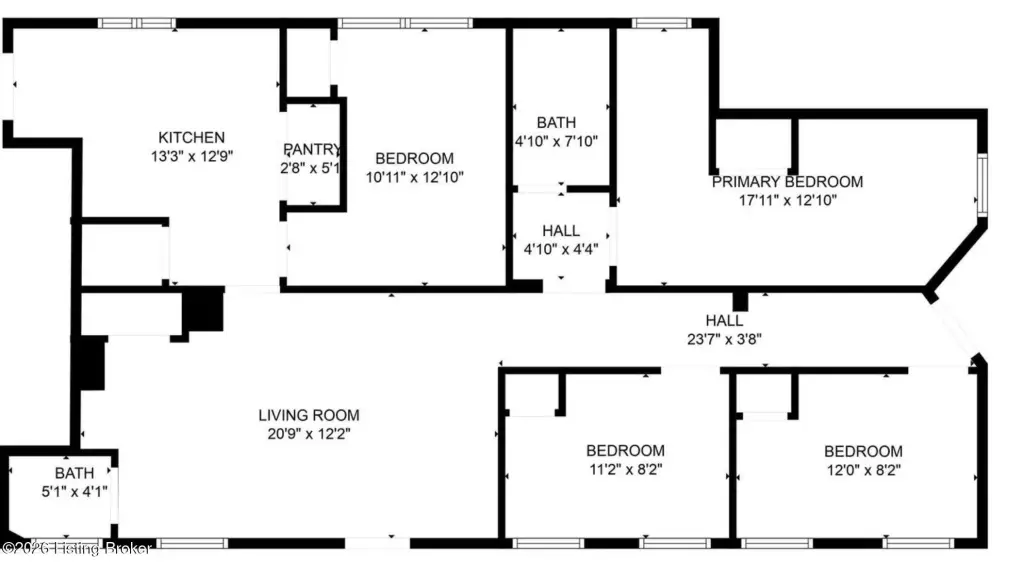
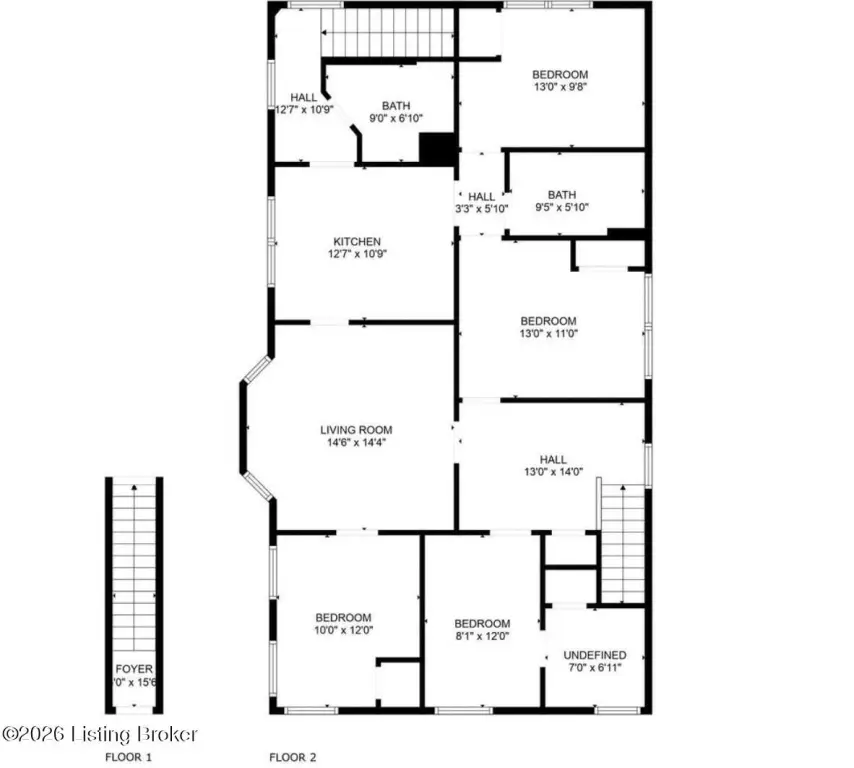
This property is a duplex with two separate residential units, each configured with four bedrooms. The listing notes new roof and gutters, which are recent exterior improvements intended to support ongoing building maintenance.
The duplex is located at 1700 Bolling Ave in Louisville, Kentucky, in Jefferson County. It is offered for sale at a listed price of $190,000. The total property size is provided as 2,563 square feet.
For buyers seeking a straightforward residential income setup, the balanced layout of four bedrooms per unit may appeal to renters looking for room to spread out. The recent roof and gutter work can also be a practical consideration for prospective owners evaluating near-term capital needs.
The duplex is located at 1700 Bolling Ave in Louisville, Kentucky, in Jefferson County. It is offered for sale at a listed price of $190,000. The total property size is provided as 2,563 square feet.
For buyers seeking a straightforward residential income setup, the balanced layout of four bedrooms per unit may appeal to renters looking for room to spread out. The recent roof and gutter work can also be a practical consideration for prospective owners evaluating near-term capital needs.
Key Highlights
- Duplex with 4 bedrooms in each unit (8 total bedrooms)
- 4 total bathrooms (Bathroom 1–4 listed)
- Central air cooling
Financial Insights For Apartment 5plus
Simulate Cap Rate and NOI
NOI Build-Up
- Vacancy
- income lost from leasable area expected to sit empty during the year — subtracted from gross rent.
- EGI (Effective Gross Income)
- gross rent minus vacancy losses — the realistic income before paying operating costs.
- OpEx (Operating Expenses)
- recurring costs to operate the property (property tax, insurance, utilities, maintenance, management) — excludes financing and capital improvements.
- NOI (Net Operating Income)
- income a property generates after operating costs but before financing and taxes.
| Component | $ | $/SF |
|---|---|---|
| Gross rent | $33.5k | $13.08 |
| − Vacancy | −$1.8k | −$0.71 |
| EGI | $31.7k | $12.37 |
| − OpEx | −$14.3k | −$5.57 |
| NOI | $17.4k | $6.81 |
2,563 SF · lease $13.08/SF/yr · vacancy 5.40% · expense 45.00%
Alternative Uses
Best Use
Multifamily LT 5
$308.1K
$269.6K – $359.4K
NOI $21,566 @ 7.0% cap · market cap 11.35%
Second Best
Apartment 5plus
$249.2K
$218.0K – $290.7K
NOI $17,443 @ 7.0% cap · market cap 9.18%
Theoretical Best
Office A
$664.3K
$581.3K – $775.1K
NOI $46,503 @ 7.0% cap · market cap 24.48%
Zoning and permitted uses should be independently verified with authorities.
Property Analytics
Property Profile
Location Intelligence
Current Use


Frequently Asked Questions
What type of property is this?
Duplex - Duplex for sale featuring two four-bedroom units and recent roof and gutter replacements.
Where is this duplex located?
The property is located at 1700 Bolling Ave Louisville, KY.
What is the asking price?
The asking price for this property is $190,000.
What are key features of this property?
This property features: Duplex with 4 bedrooms in each unit (8 total bedrooms); 4 total bathrooms (Bathroom 1–4 listed); Central air cooling


