Ten-Unit Apartment
For Sale
$4,800,000
168 1/2 Delancey Street, Manhattan, NY 10002
Residential property with an additional commercial unit and access to Lower East Side transit and retail destinations.
Property Size9,250 SF
Lot Size0.03 Acres
Price / SF$518.92
Days on Market1622
Property Features for 168 1/2 Delancey Street
General Information
Standard status
Active
Size
9,250 SF
Lot size
0.03 Acres
Property subtype
Multi Family
Zoning
C7
Additional Details
Public Transit
Yes
Multifamily Units
10
Taxes and HOA fees
Annual Taxes
$60,039
Amenities
No, No, On Street
Partially Finished
Apartment, Bridge(s), Near Public Transportation, Park, Public
28
2+ Common Walls
Square Feet
Near Public Transportation, Bridge View
Yes
No
Brick
On Street, Park, Near Public Transportation, Near Public Transit
Building Details
Year Built
1900
Listing Agency:
Edward J Cuccia
Listed By:
Siu Wai Cheung · License #10401230791
(212) 966-7775
Source:
Compass
Added: May 13, 2022
Changed: Oct 19
Last Checked: Oct 19 at 8:56AM
Displayed information is deemed reliable but is not guaranteed and should be independently verified. All listing content including descriptions, pricing, images are the copyrighted material of Edward J Cuccia

Ask AI about this property
Review the available facts, identify missing information and prepare questions for the agent.
Investment Insights
Based on property information with market context.
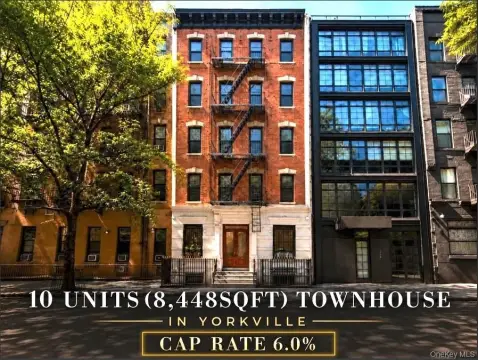
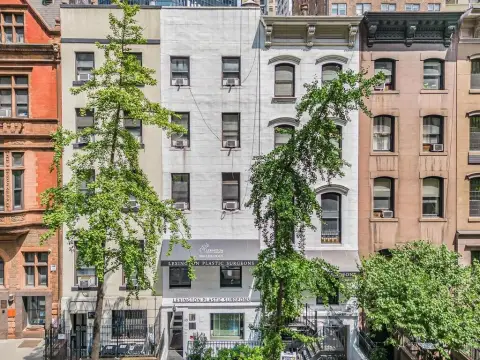
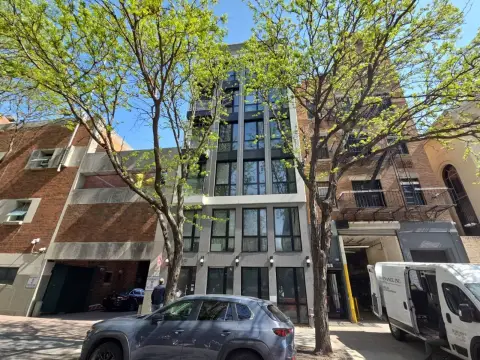
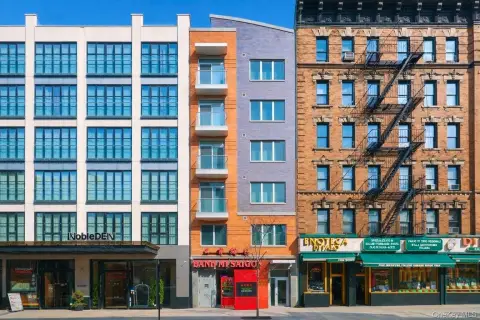
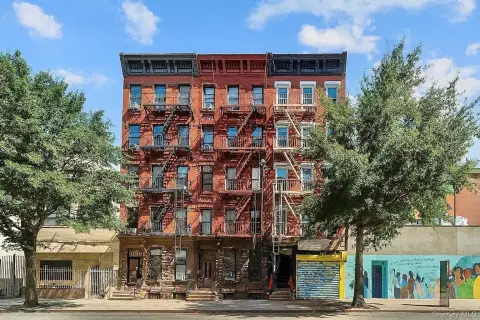
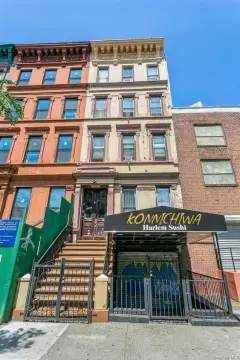
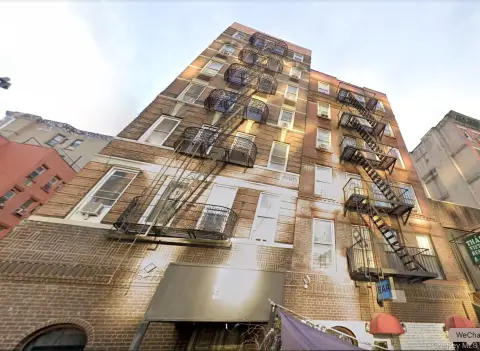
Located at 168 1/2 Delancey Street in Manhattan, this apartment building contains 10 residential units alongside 1 commercial unit. The property totals 9,250 square feet on a 25-by-60-foot lot and carries C7 zoning. Built in 1900, the brick structure includes partially finished interior space and a bridge view.
The property is positioned 3 blocks from the Delancey F, M, J and Z train stations, with Essex Market, Regal Essex Crossing, Trader Joe’s and Target nearby. The surrounding area also includes dining, shopping, nightlife and cultural destinations. Essex Crossing and One Manhattan Square are among the large developments in the surrounding area.
The property is positioned 3 blocks from the Delancey F, M, J and Z train stations, with Essex Market, Regal Essex Crossing, Trader Joe’s and Target nearby. The surrounding area also includes dining, shopping, nightlife and cultural destinations. Essex Crossing and One Manhattan Square are among the large developments in the surrounding area.
Key Highlights
- 10 residential units plus 1 commercial unit
- 9,250‑square‑foot property on a 25‑by‑60‑foot lot
- C7 zoning
Financial Insights
Estimated NOI and Cap Rate
NOI / Yr
$291,375
Cap Rate
6.07%
Suggested Prices Based on Cap Rates
Cap Rate 5%
$5,827,500
$5.8M
Cap Rate 7%
$4,162,500
$4.2M
Cap Rate 9%
$3,237,500
$3.2M
Market Conditions
NOI Build-Up for 9,250 SF
Gross rent
$555.0K $60.00/SF
− Vacancy
−$88.8K −$9.60/SF
EGI
$466.2K $50.40/SF
− OpEx
−$174.8K −$18.90/SF
NOI
$291.4K $31.50/SF
Area
ZIP 10002
Vacancy
16.00%
Lease Rate
$60.00 /SF/Yr
Expense Ratio
37.50%
Simulate Cap Rate and NOI
Suggested Prices Based on Cap Rates
Cap Rate 5%
$5,827,500
Cap Rate 7%
$4,162,500
Cap Rate 9%
$3,237,500
Alternative Uses
Best Use
Mixed Use
$4.16M
$3.64M – $4.86M
NOI $291,375 @ 7.0% cap · market cap 6.07%
Second Best
Apartment 5plus
$4.15M
$3.63M – $4.84M
NOI $290,321 @ 7.0% cap · market cap 6.05%
Theoretical Best
Specialty Retail
$23.02M
$20.15M – $26.86M
NOI $1,611,720 @ 7.0% cap · market cap 33.58%
Zoning and permitted uses should be independently verified with authorities.
How Realmo checks its estimates
Property Analytics
Current Use
Lease Details
10
Residential units
Location Intelligence
Trade Area within ½ mile
16,229
Businesses Nearby
Explore this area
Business Placement
Demographics for 10002, NY
82,155
Population
39,646
Households
2.1
Avg Household Size
41
Median Age
39%
College-Educated
71%
High-School Grad
0.8 sq mi
ZIP Area
102,694
Density / Sq Mi
$46,525
Median Household Income
$51,425
Median Earnings
$1,207
Median Rent
$808,500
Median Home Value
Market
Vacancy Rate% for Multifamily in Northeast region




Frequently Asked Questions
What type of property is this?
Apartment building - Residential property with an additional commercial unit and access to Lower East Side transit and retail destinations.
Where is this apartment building located?
The property is located at 168 1/2 Delancey Street Manhattan, NY.
What is the asking price?
The asking price for this property is $4,800,000.
What are key features of this property?
This property features: 10 residential units plus 1 commercial unit; 9,250‑square‑foot property on a 25‑by‑60‑foot lot; C7 zoning


