Corner Commercial Building with Drive-In
For Sale
$2,500,000
165 Midland Avenue, Lexington, KY 40508
Updated 1949 building with expansive open areas, private offices, 26 parking spaces, and three drive-in doors.
Property Size14,719 SF
Price / SF$169.85
Days on Market181
Property Features for 165 Midland Avenue
General Information
Standard status
Active
Size
14,719 SF
Total Parking Spaces
26
Property subtype
Industrial
Zoning
B-4
Site & Location
Neighborhood
William Wells Brown Neighborhood Assoc
Additional Details
Drive-In Doors
3
Building Details
Year Built
1949
Listing Agency:
Block & Lot Real Estate
Listed By:
Colleen Barr · License #52773
(859) 489-6133
Source:
Kcrea.resimplifi
Added: Apr 28
Changed: Oct 16
Last Checked: Oct 24 at 1:24PM
Displayed information is deemed reliable but is not guaranteed and should be independently verified. All listing content including descriptions, pricing, images are the copyrighted material of Block & Lot Real Estate

Ask AI about this property
Review the available facts, identify missing information and prepare questions for the agent.
Investment Insights
Based on property information with market context.
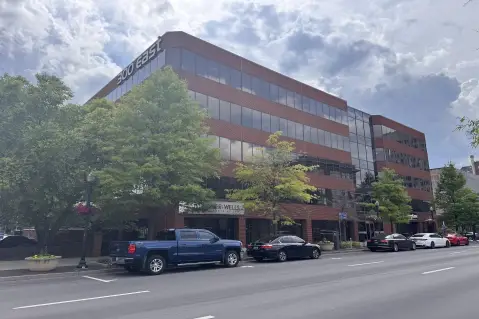
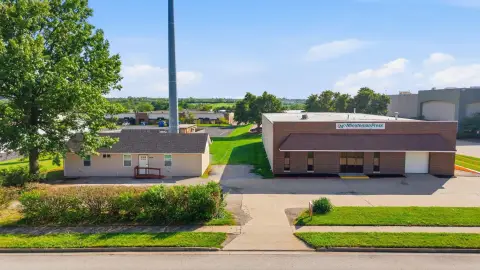
Located just outside the Central Business District, this updated 1949 commercial building offers visibility along Midland Avenue and direct exposure to The Legacy Trail. The building is currently configured as a fitness facility and includes expansive open areas, private offices upstairs, and three drive-in doors that support flexible operations. A total of approximately 26 parking spaces serves customers and staff.
The property sits on the corner of Midland Avenue and Corral Street, adjacent to Thoroughbred Park, and directly across from the Fayette County Public Schools Career and Technical Education Building. This corner setting also places the site near Lexington’s Central Business District, the UK Medical Center, and local arts and Downtown park features.
Zoned B-4, the building is well-suited for office, showroom, storage, or a combination of uses, depending on the tenant’s requirements.
The property sits on the corner of Midland Avenue and Corral Street, adjacent to Thoroughbred Park, and directly across from the Fayette County Public Schools Career and Technical Education Building. This corner setting also places the site near Lexington’s Central Business District, the UK Medical Center, and local arts and Downtown park features.
Zoned B-4, the building is well-suited for office, showroom, storage, or a combination of uses, depending on the tenant’s requirements.
Key Highlights
- 14,000± SF commercial building built in 1949 with expansive open areas and private offices upstairs
- Three drive‑in doors for operational flexibility
- 26± on‑site parking spaces for customers and staff
Financial Insights
Estimated NOI and Cap Rate
NOI / Yr
$164,529
Cap Rate
6.58%
Suggested Prices Based on Cap Rates
Cap Rate 5%
$3,290,580
$3.3M
Cap Rate 7%
$2,350,414
$2.4M
Cap Rate 9%
$1,828,100
$1.8M
Market Conditions
NOI Build-Up for 14,719 SF
Gross rent
$264.9K $18.00/SF
− Vacancy
−$45.6K −$3.10/SF
EGI
$219.4K $14.90/SF
− OpEx
−$54.8K −$3.73/SF
NOI
$164.5K $11.18/SF
Area
Lexington, KY
Vacancy
17.20%
Lease Rate
$18.00 /SF/Yr
Expense Ratio
25.00%
Simulate Cap Rate and NOI
Suggested Prices Based on Cap Rates
Cap Rate 5%
$3,290,580
Cap Rate 7%
$2,350,414
Cap Rate 9%
$1,828,100
Alternative Uses
Best Use
Office B
$2.35M
$2.06M – $2.74M
NOI $164,529 @ 7.0% cap · market cap 6.58%
Second Best
—
—
no second resolved use
Theoretical Best
Office A
$3.07M
$2.68M – $3.58M
NOI $214,667 @ 7.0% cap · market cap 8.59%
Zoning and permitted uses should be independently verified with authorities.
How Realmo checks its estimates
Property Analytics
Who owns this building?
See the owner, sales and loan history
Open Analytics
Current Use
Lease Details
3
Drive-in doors
Location Intelligence
Trade Area within ½ mile
2,694
Businesses Nearby
Well-served
Demand for This Use
Explore this area
Business Placement
Demographics for 40508, KY
25,586
Population
11,458
Households
2.2
Avg Household Size
26
Median Age
36%
College-Educated
86%
High-School Grad
4.2 sq mi
ZIP Area
6,092
Density / Sq Mi
$28,040
Median Household Income
$13,316
Median Earnings
$900
Median Rent
$174,900
Median Home Value
Check the figures for this property
Cap Rate, Value Estimation, Potential NOI and more
View Realmo Analytics
Market
Vacancy Rate% for Office in South region





Similar Off Market Nearby
- E.J Nutter Training Facility — 720 Sports Center Dr, Lexington, KY 40508
- Shine Pilates Lex — 606 Euclid Ave #3, Lexington, KY 40502
- Dynamic Wellness — 620 Euclid Ave Ste 102 A, Lexington, KY 40502
- Classical Pilates — 283 lincoln ave suite 102, lexington, ky 40502
- Mind Over Body Studio — 490 E High St, Lexington, KY 40507
Frequently Asked Questions
What type of property is this?
Fitness center & gym - Updated 1949 building with expansive open areas, private offices, 26 parking spaces, and three drive-in doors.
Where is this fitness center & gym located?
The property is located at 165 Midland Avenue Lexington, KY.
What is the asking price?
The asking price for this property is $2,500,000.
What are key features of this property?
This property features: 14,000± SF commercial building built in 1949 with expansive open areas and private offices upstairs; Three drive‑in doors for operational flexibility; 26± on‑site parking spaces for customers and staff


