Waterfront
For Sale
$695,000
1649 Edith Esplanade, Cape Coral, FL 33904
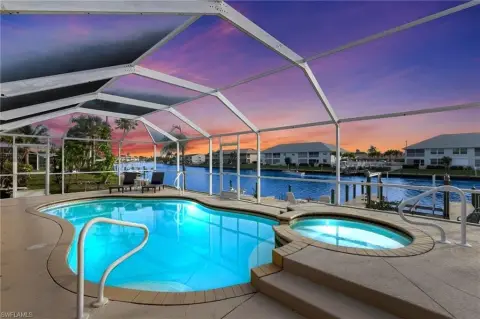
Canal-side duplex with multifamily zoning, water views, and access toward the river and Gulf of Mexico.
Property Size1,600 SF
Price / SF$434.38
Days on Market71
Property Features for 1649 Edith Esplanade
General Information
Standard status
Active
Size
1,600 SF
Property subtype
Multi-Family
Additional Details
Multifamily Units
2
Building Details
Year Built
1961
Listing Agency:
RE/MAX Realty Team
Listed By:
Phil Derry · License #258004233
(239) 209-7777
Source:
Swfloridarealestate
Added: Aug 4
Changed: Oct 9
Last Checked: Oct 13 at 12:33AM
Displayed information is deemed reliable but is not guaranteed and should be independently verified. All listing content including descriptions, pricing, images are the copyrighted material of RE/MAX Realty Team
Investment Insights
Based on property information with market context.
Built in 1961, this 1,600-square-foot duplex occupies a canal-front parcel with deep-water access and no bridge crossings on the route to open water. The existing configuration may remain in place, while multifamily zoning and approvals for up to 10 units support expanded development options. Water views extend toward both the river and basin, adding a distinct waterfront setting to the property.
The address is in Cape Coral, Florida, with access to the river and the Gulf of Mexico. The duplex remained dry during Hurricane Ian. The site can support continued duplex use or a larger multifamily project, subject to applicable plans and approvals.
The address is in Cape Coral, Florida, with access to the river and the Gulf of Mexico. The duplex remained dry during Hurricane Ian. The site can support continued duplex use or a larger multifamily project, subject to applicable plans and approvals.
Key Highlights
- 1,600‑square‑foot duplex built in 1961
- Direct canal frontage with deep‑water access and no bridges
- Multifamily zoning with approvals for up to 10 units
Financial Insights
Estimated NOI and Cap Rate
NOI / Yr
$21,178
Cap Rate
3.05%
Suggested Prices Based on Cap Rates
Cap Rate 5%
$423,560
$423.6K
Cap Rate 7%
$302,543
$302.5K
Cap Rate 9%
$235,311
$235.3K
Market Conditions
NOI Build-Up for 1,600 SF
Gross rent
$31.7K $19.80/SF
− Vacancy
−$1.4K −$0.89/SF
EGI
$30.3K $18.91/SF
− OpEx
−$9.1K −$5.67/SF
NOI
$21.2K $13.24/SF
Area
Cape Coral, FL
Vacancy
4.50%
Lease Rate
$19.80 /SF/Yr
Expense Ratio
30.00%
Simulate Cap Rate and NOI
Suggested Prices Based on Cap Rates
Cap Rate 5%
$423,560
Cap Rate 7%
$302,543
Cap Rate 9%
$235,311
Alternative Uses
Best Use
Multifamily LT 5
$302.5K
$264.7K – $353.0K
NOI $21,178 @ 7.0% cap · market cap 3.05%
Second Best
Apartment 5plus
$280.4K
$245.3K – $327.1K
NOI $19,626 @ 7.0% cap · market cap 2.82%
Theoretical Best
Office A
$415.2K
$363.3K – $484.4K
NOI $29,061 @ 7.0% cap · market cap 4.18%
Zoning and permitted uses should be independently verified with authorities.
How Realmo checks its estimates
Property Analytics
Unlock full access to Insights
Subscribe to Realmo Intelligence
Open Analytics
Current Use
Lease Details
2
Residential units
Location Intelligence
Trade Area within ½ mile
1,574
Businesses Nearby
Explore this area
Business Placement
Demographics for 33904, FL
32,029
Population
20,401
Households
1.6
Avg Household Size
56
Median Age
29%
College-Educated
95%
High-School Grad
9.7 sq mi
ZIP Area
3,302
Density / Sq Mi
$66,933
Median Household Income
$43,829
Median Earnings
$1,665
Median Rent
$347,100
Median Home Value
Check the figures for this property
Cap Rate, Value Estimation, Potential NOI and more
View Realmo Analytics
Market
Vacancy Rate% for Multifamily in South region

Questions? Ask Rey
Realmo’s AI knows this listing — price, zoning, demand, history. Ask anything.




Frequently Asked Questions
What type of property is this?
Duplex - Canal-side duplex with multifamily zoning, water views, and access toward the river and Gulf of Mexico.
Where is this duplex located?
The property is located at 1649 Edith Esplanade Cape Coral, FL.
What is the asking price?
The asking price for this property is $695,000.
What are key features of this property?
This property features: 1,600‑square‑foot duplex built in 1961; Direct canal frontage with deep‑water access and no bridges; Multifamily zoning with approvals for up to 10 units