Standalone Office Building with Backup
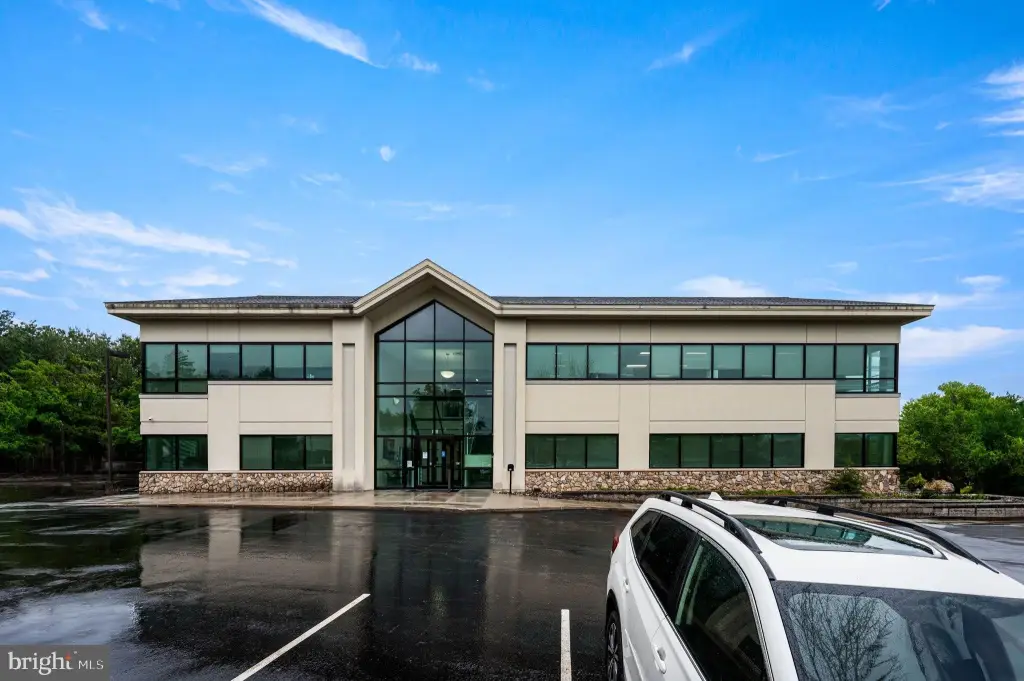
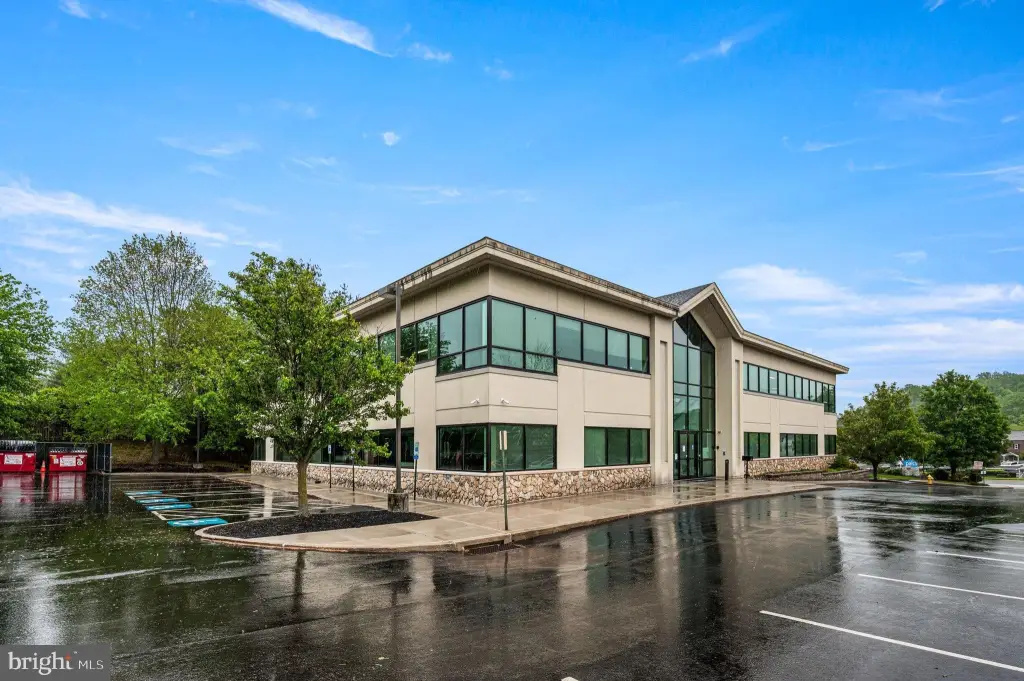
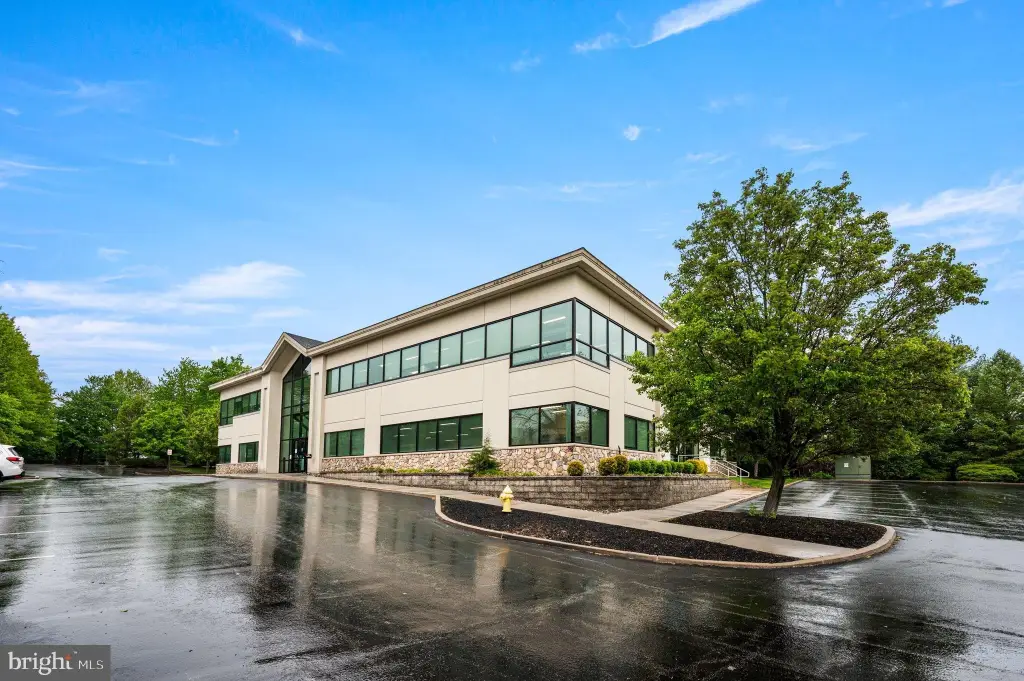
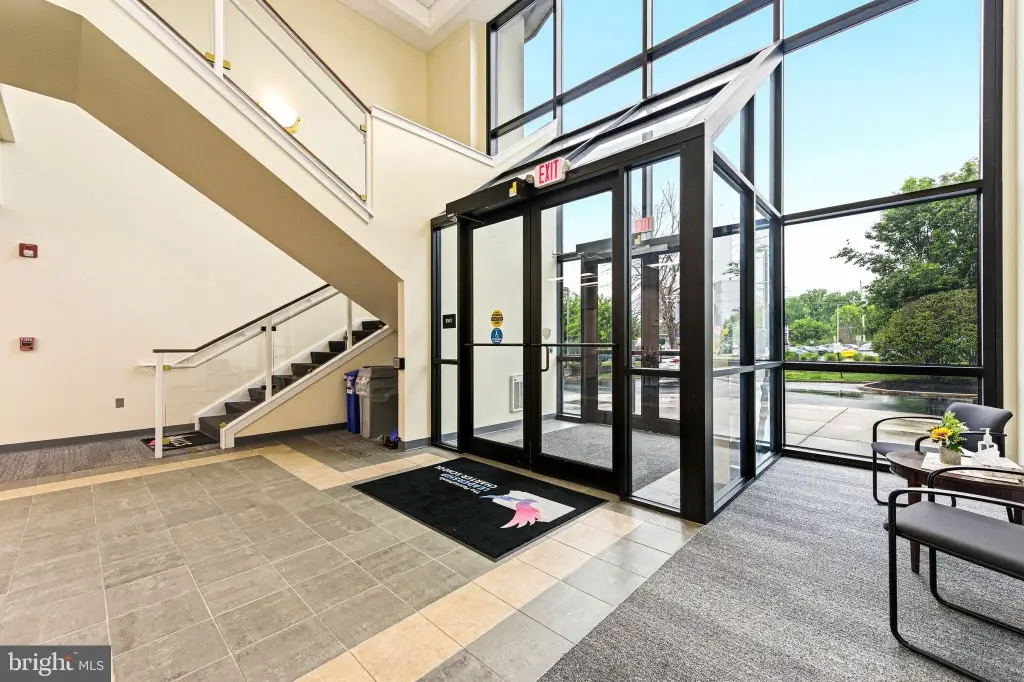
For Sale
$5,000,000
1645 W CHESTER Pike, West Chester, PA 19382
Commercial Sale, WEST CHESTER, PA
Property Size20,000 SF
Lot Size2.60 Acres
Price / SF$250
Days on Market142
Property Features for 1645 W CHESTER Pike
General Information
Property type
Other
Property subtype
Office
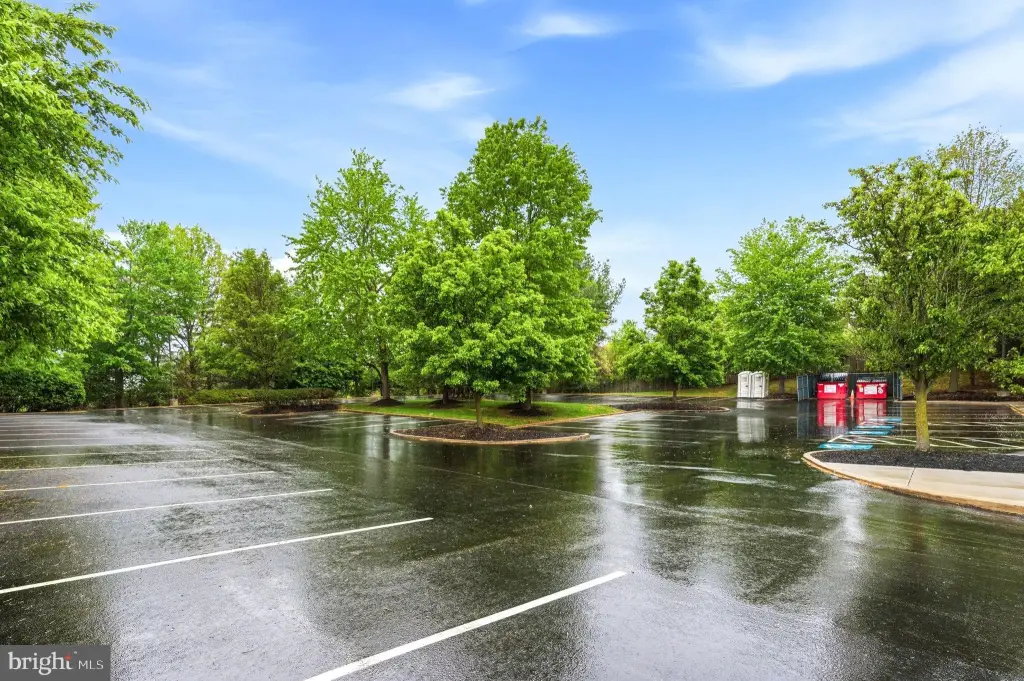
Parking
100
Parking features
Parking Lot, Special Needs
Elementary school district
WEST CHESTER AREA
Middle school district
WEST CHESTER AREA
High school district
WEST CHESTER AREA
Standard status
Active
Lot size
2.60 Acres
Taxes and HOA fees
Tax Annual Amount
0
Utilities
Heating system
Forced Air
Cooling system
Central Air
Amenities
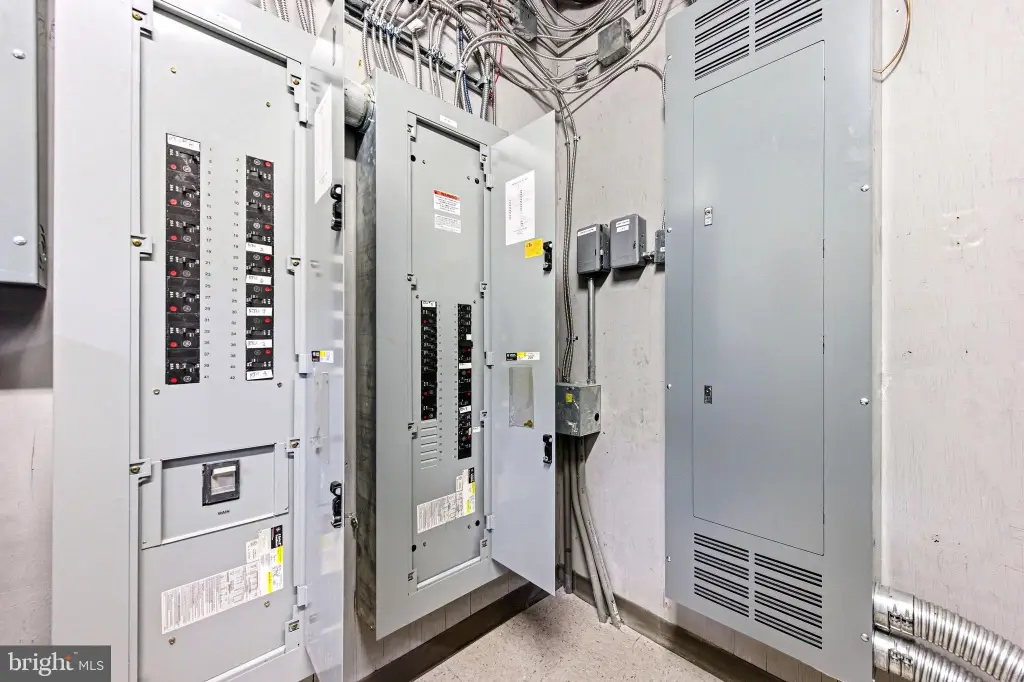
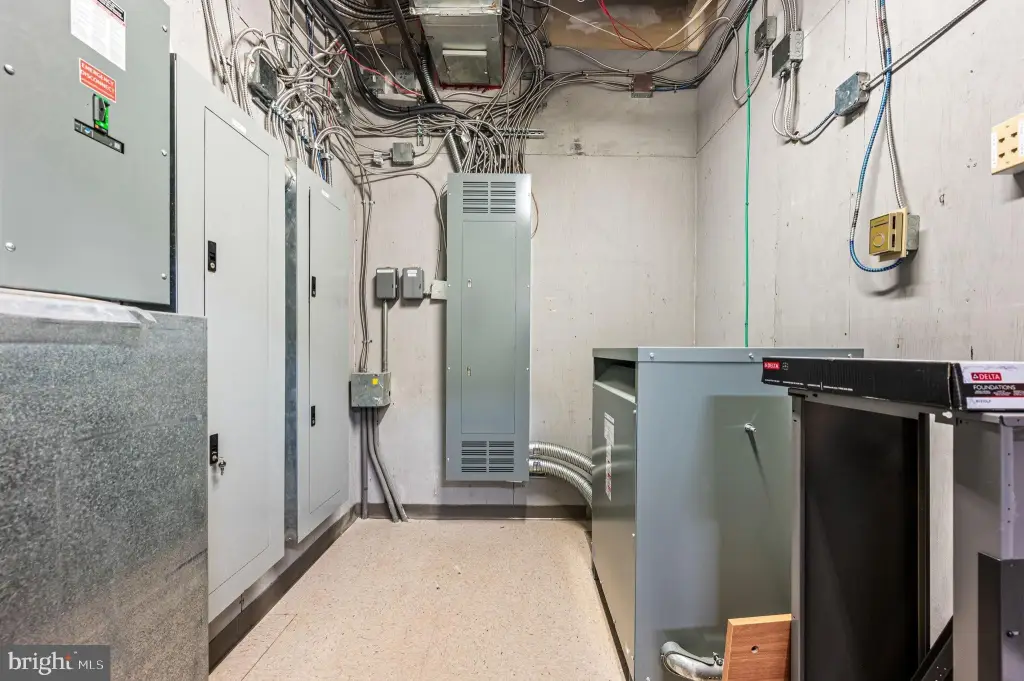
600 AMP 3-phase power
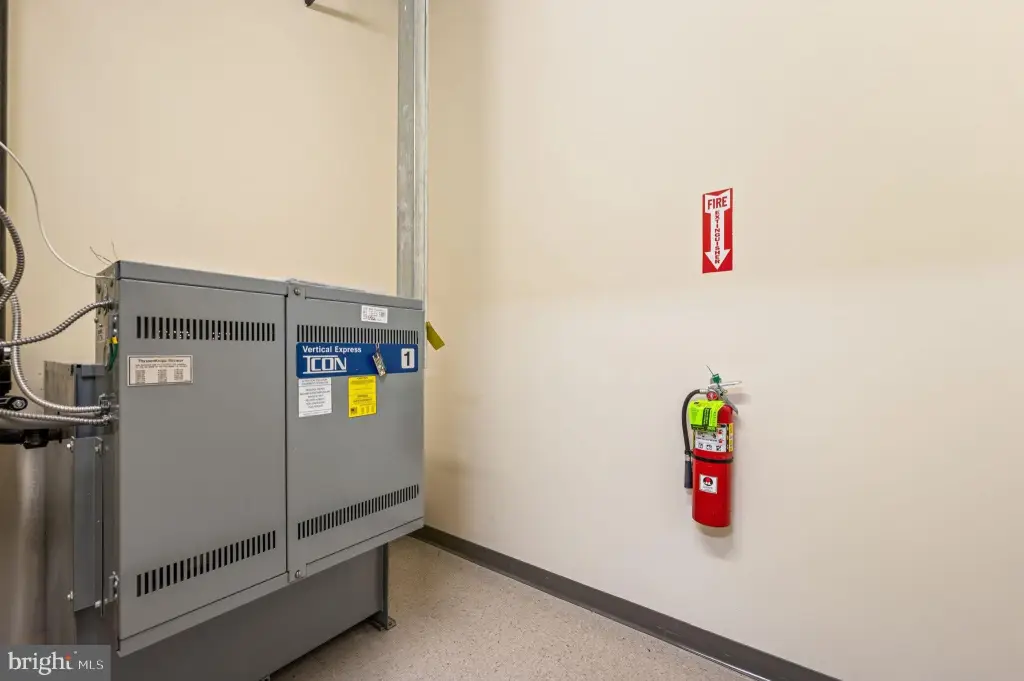
full-building Cummins backup generator
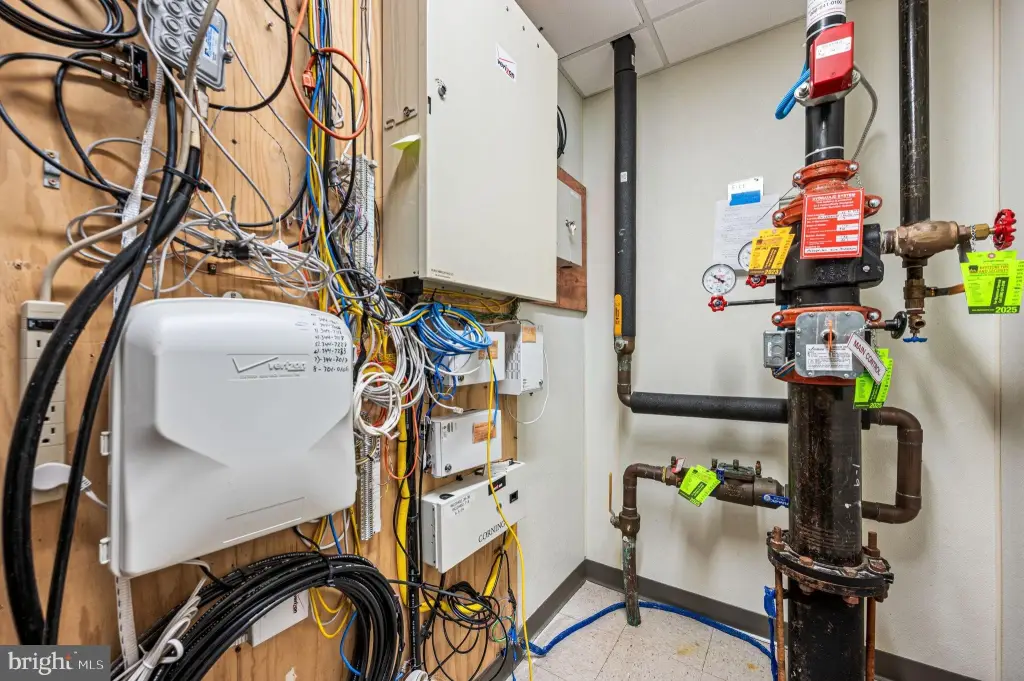
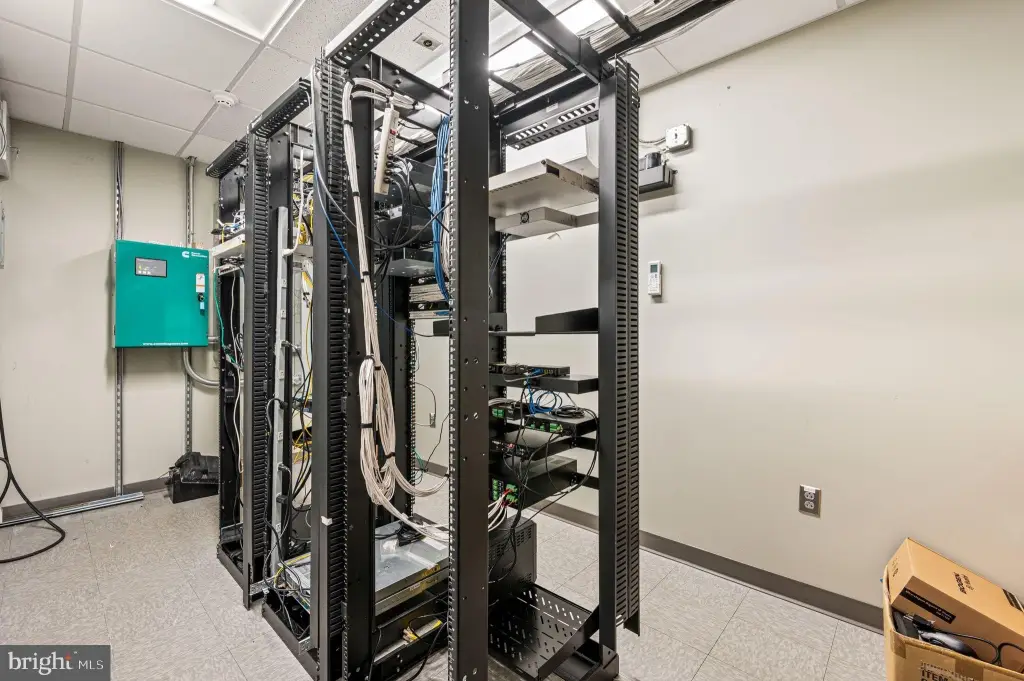
fiber-optic connectivity
Building Details
Year built
2006
Building materials
Combination
Listing Agency:
Keller Williams Realty Group
Listed By:
Timothy Brian Hennessey · License #RS371073
(610) 792-5900
Added: May 25
Changed: Sep 1
Last Checked: Oct 13 at 6:06PM
MLS# PACT2124848
Copyright © 2026 Bright MLS. All rights reserved. All information provided by the listing agent/broker is deemed reliable but is not guaranteed and should be independently verified.
Investment Insights
Based on property information with market context.
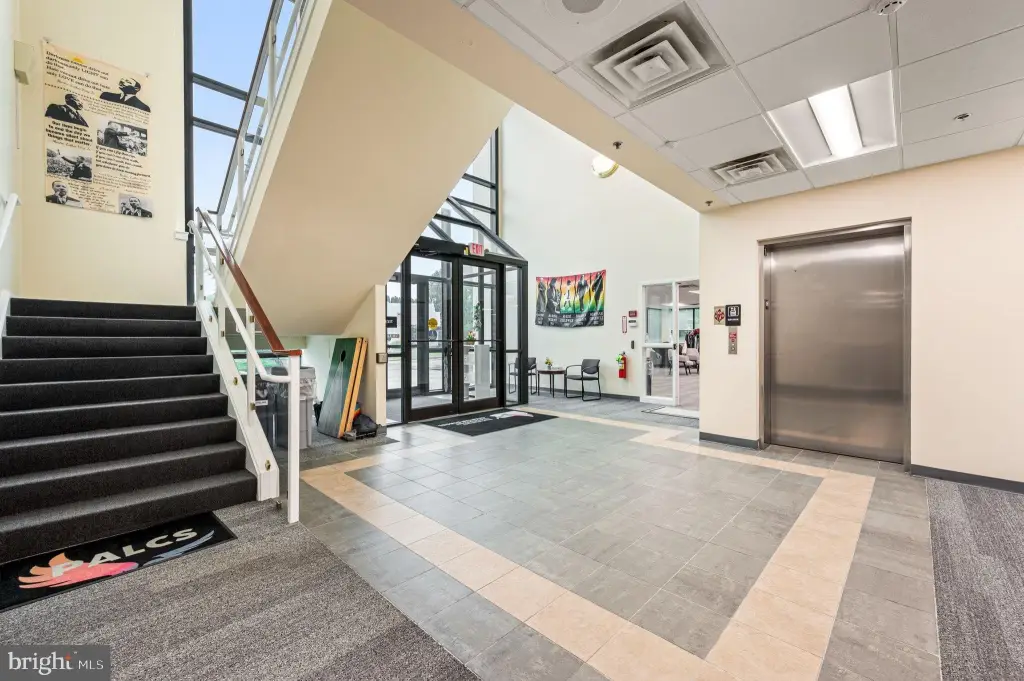
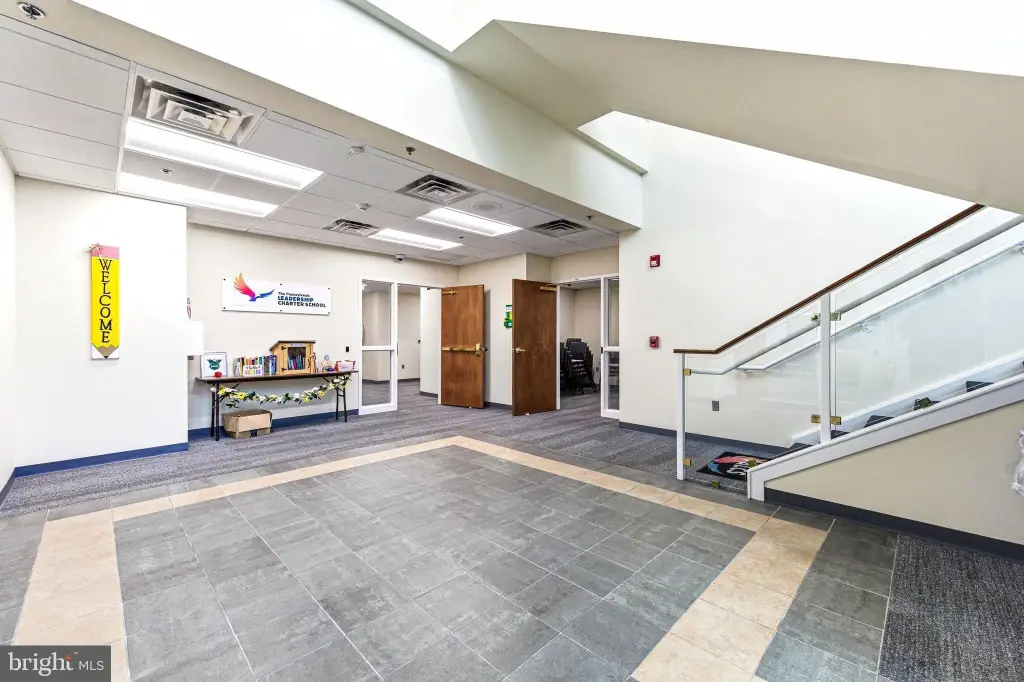
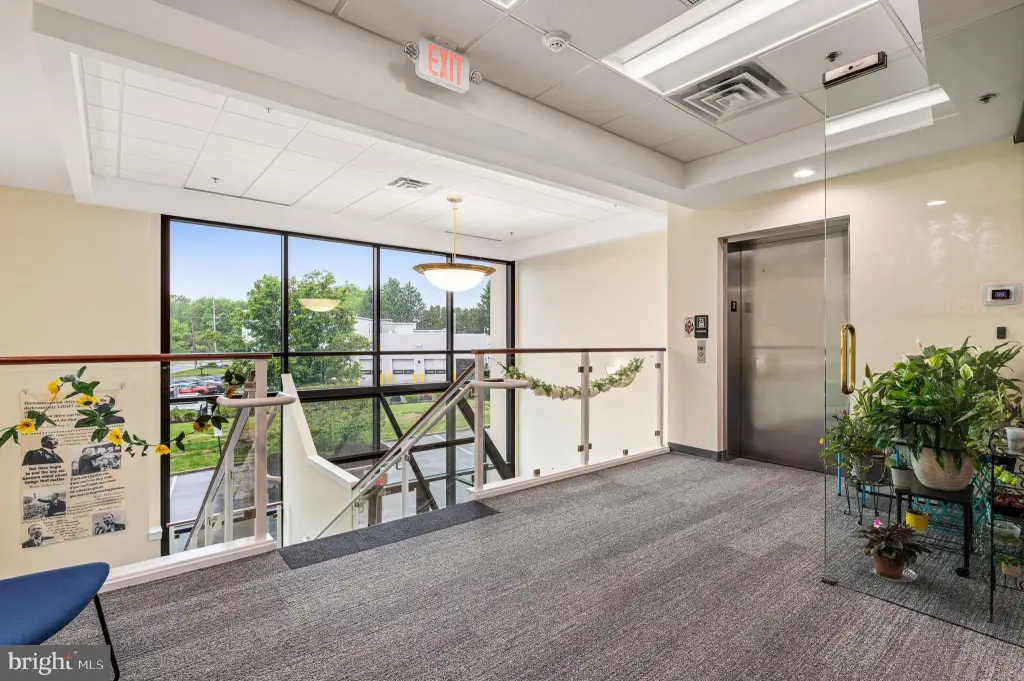
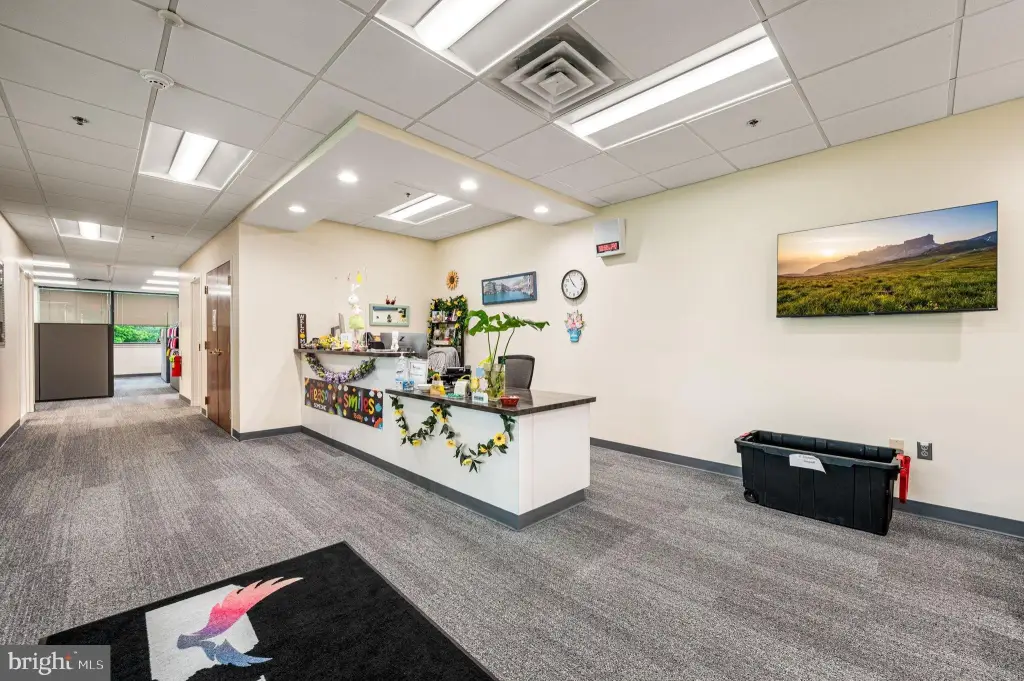
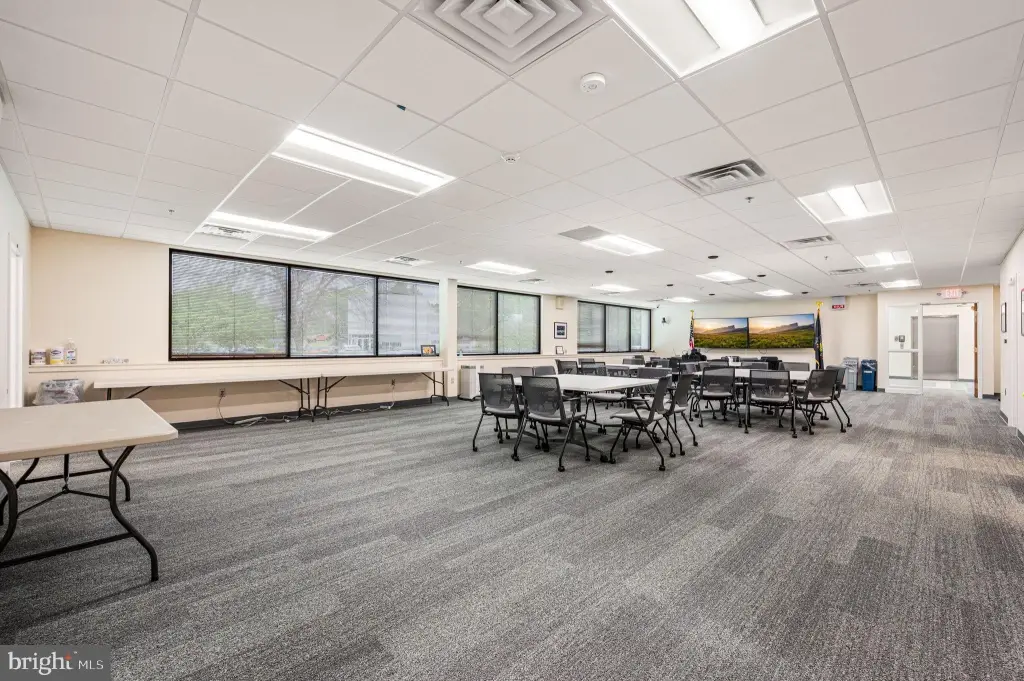
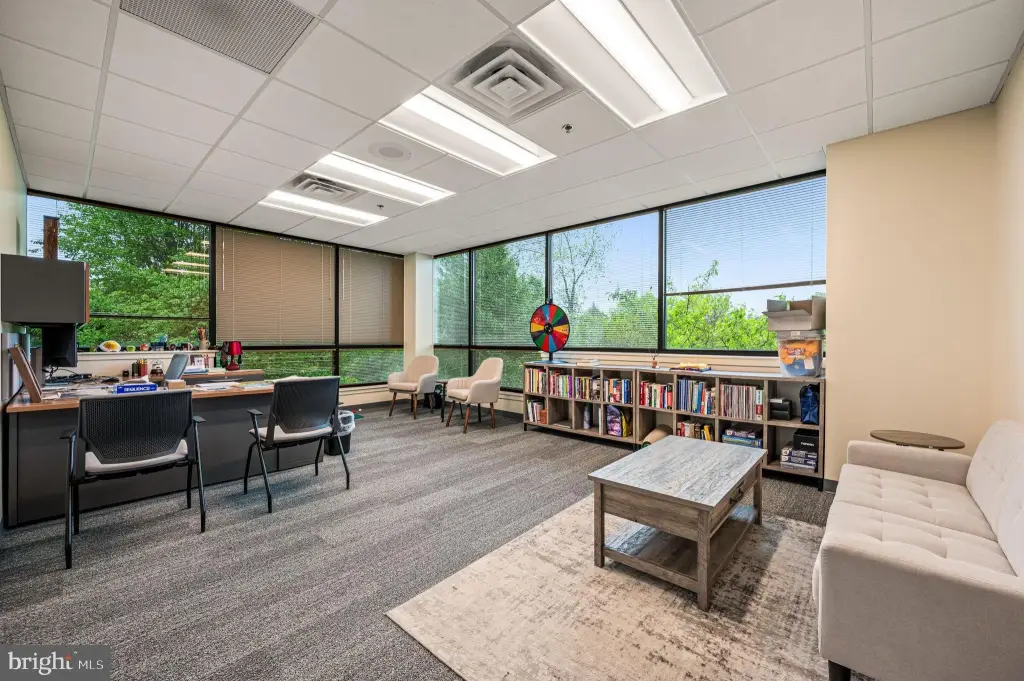
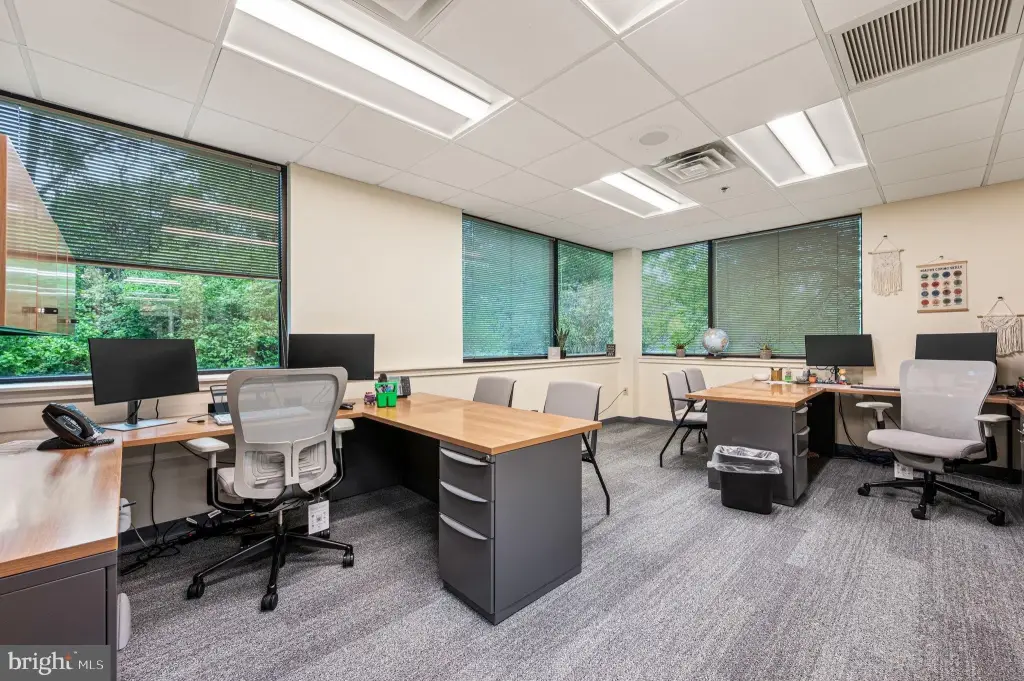
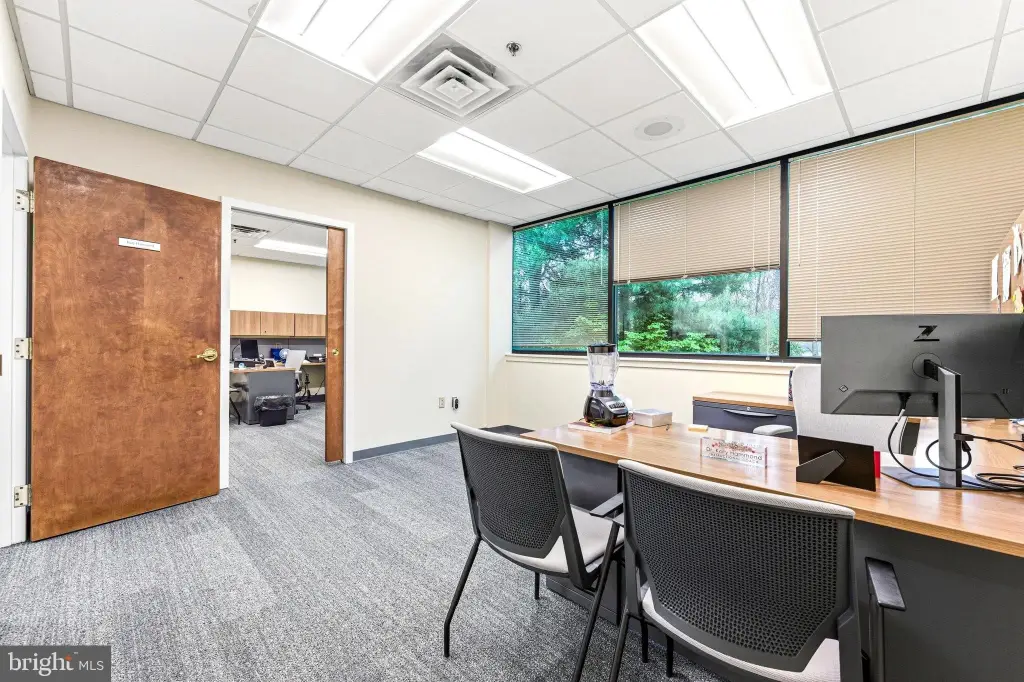
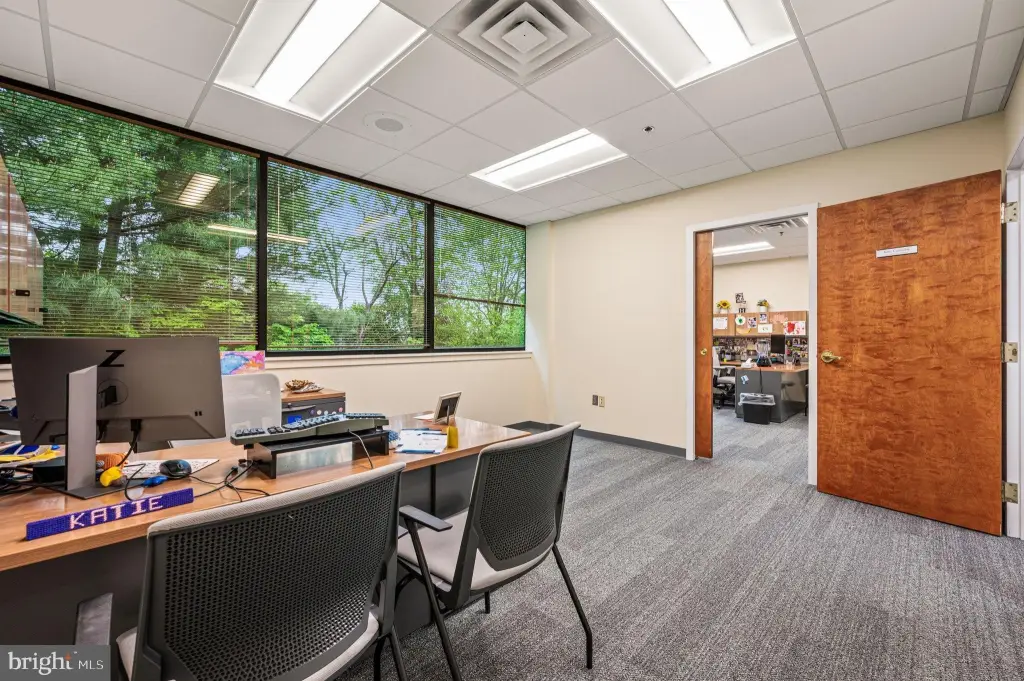
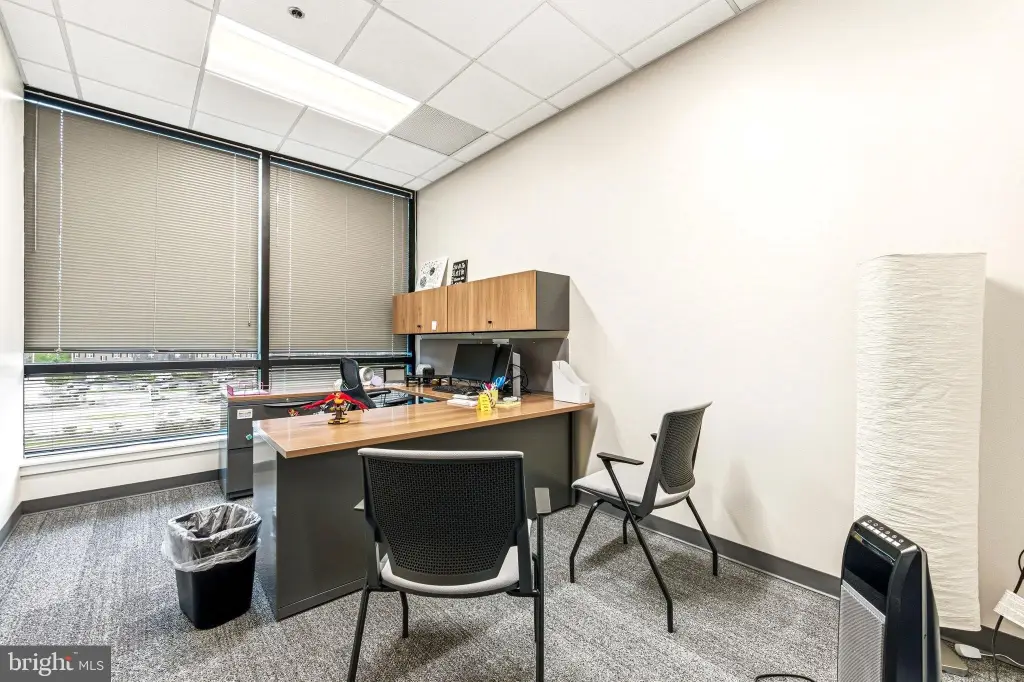
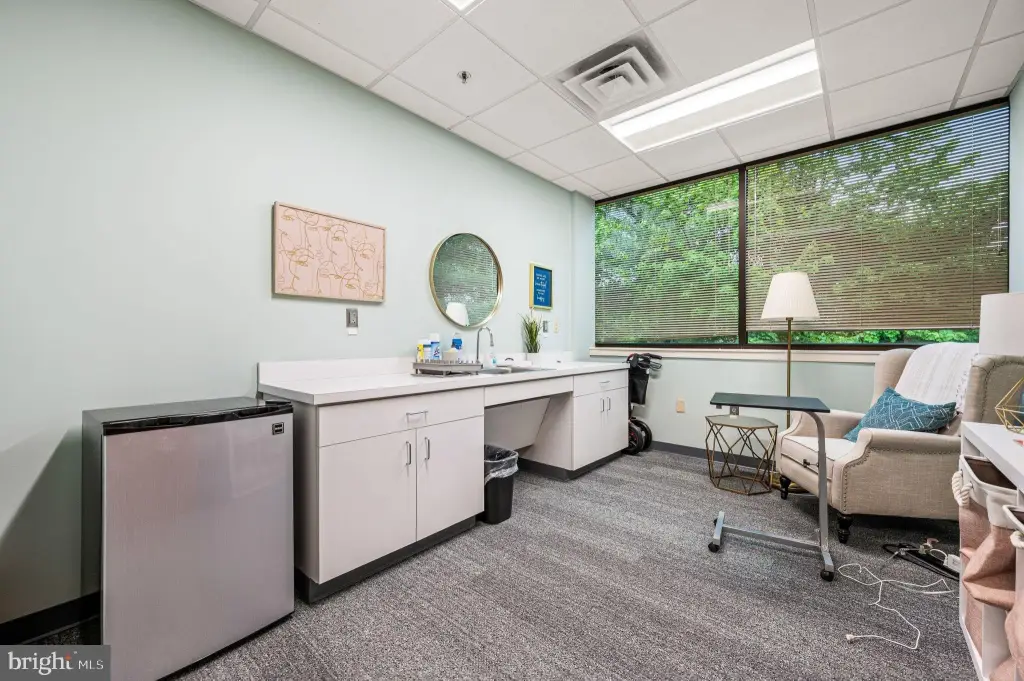
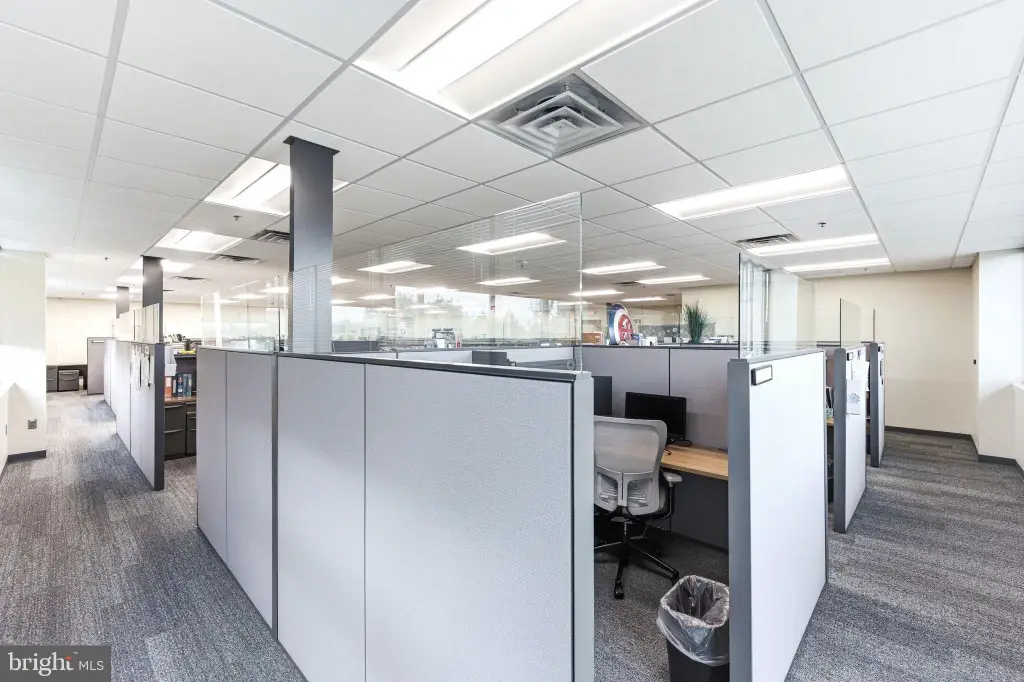
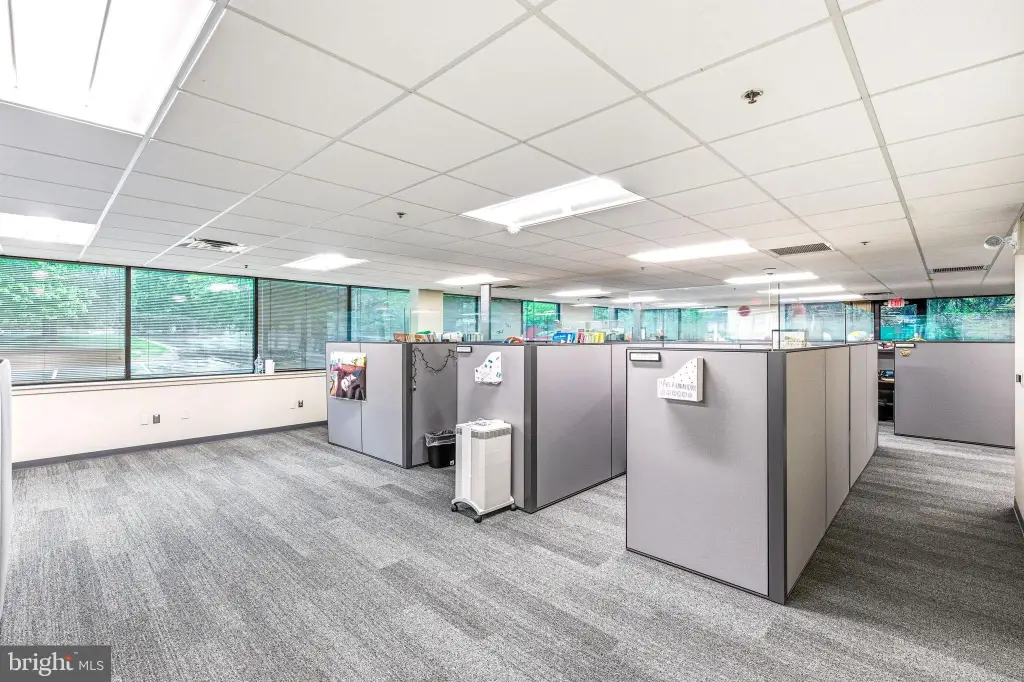
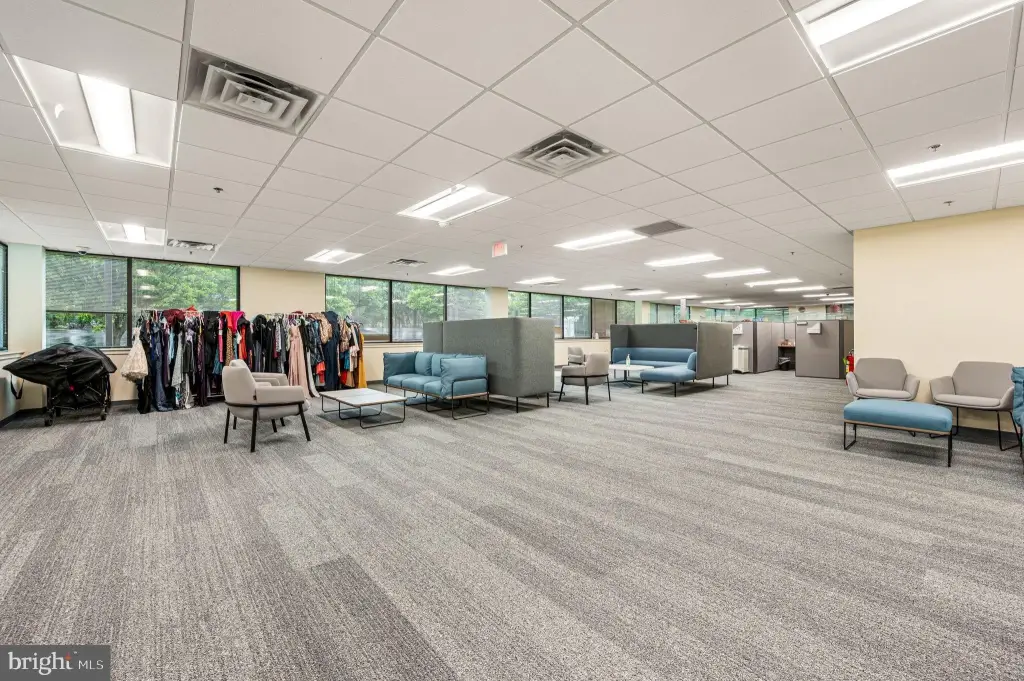
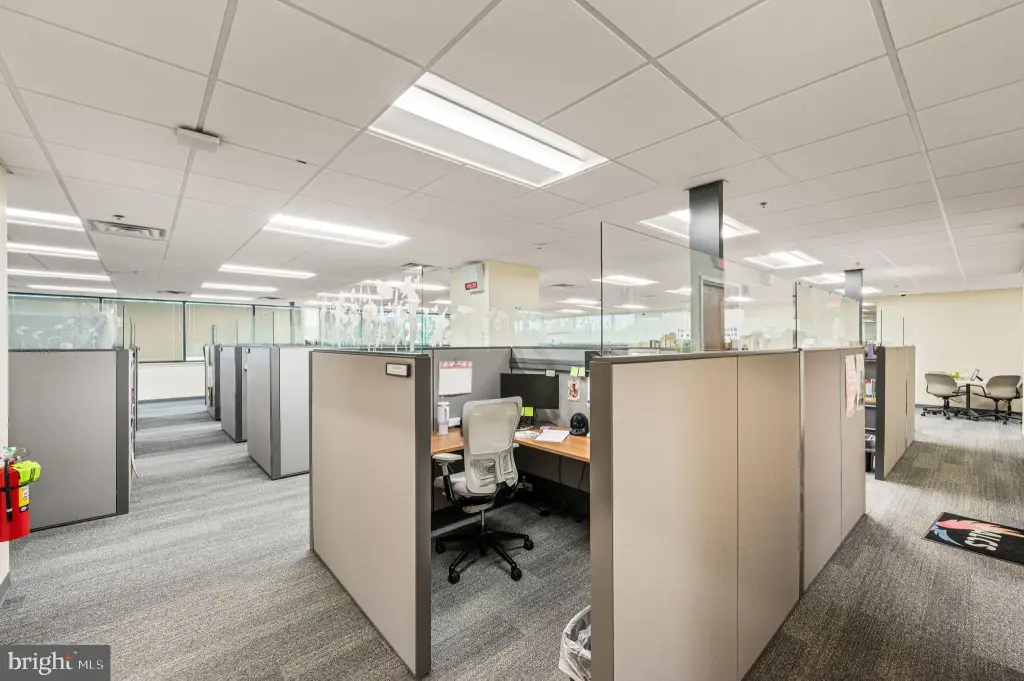
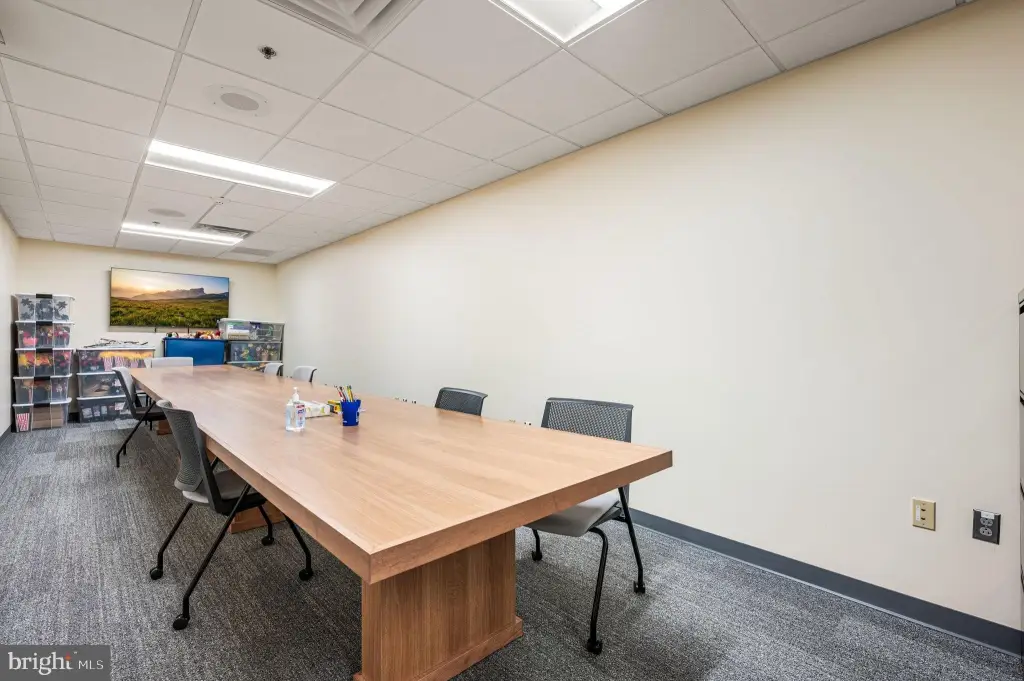
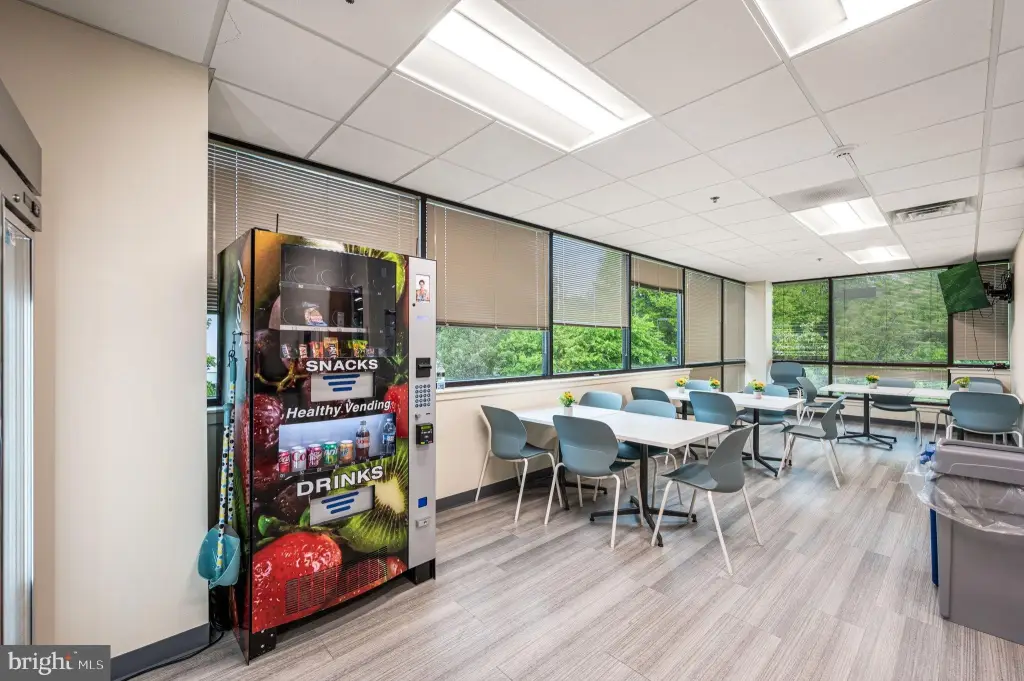
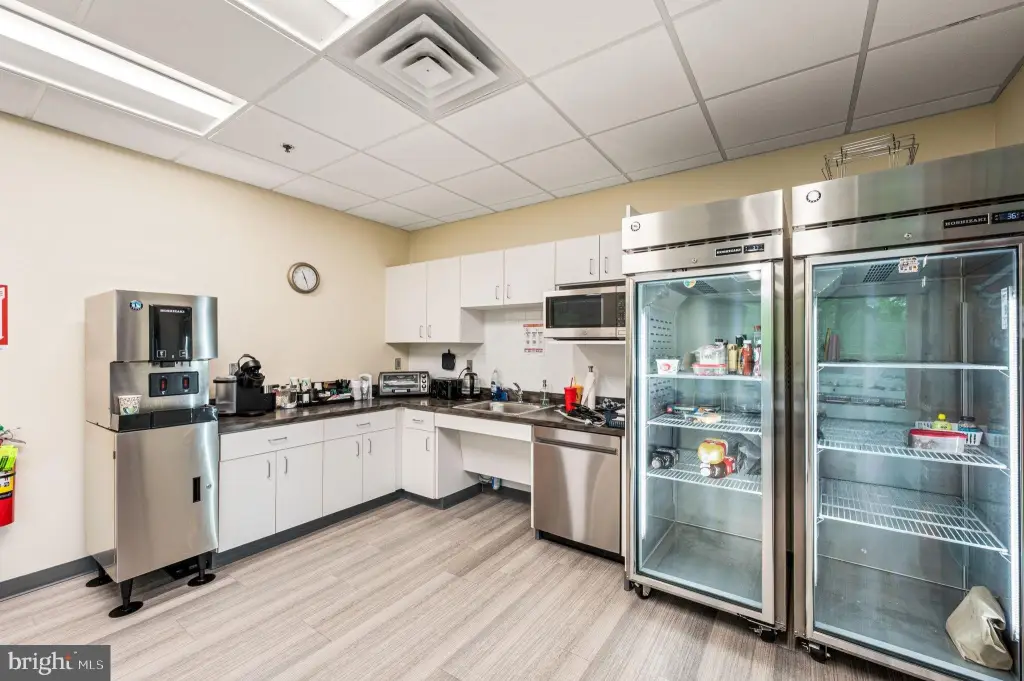
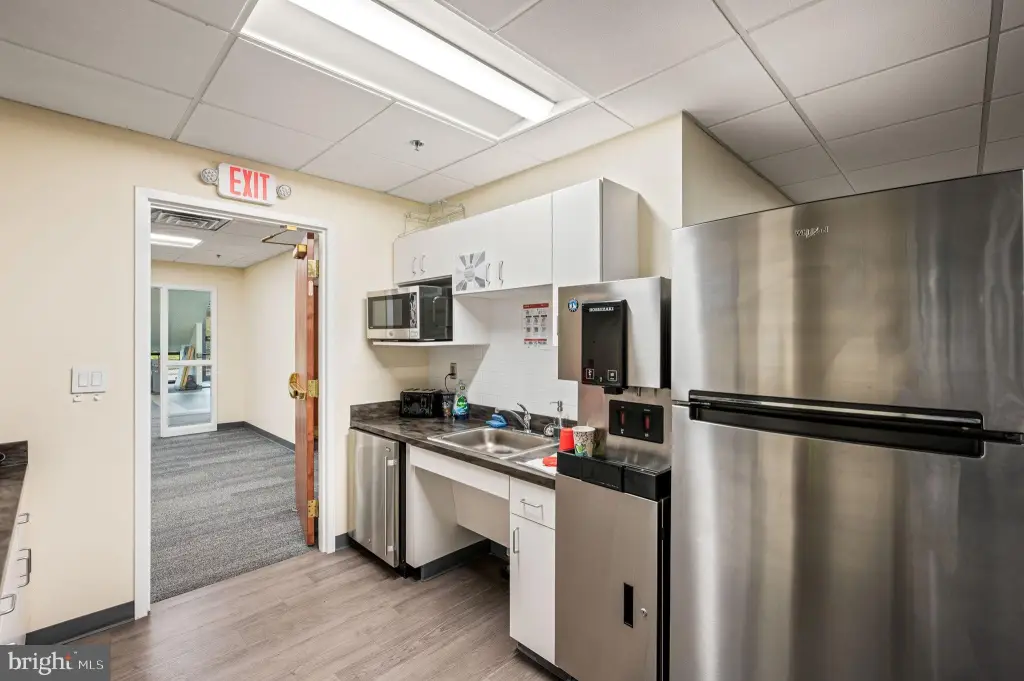
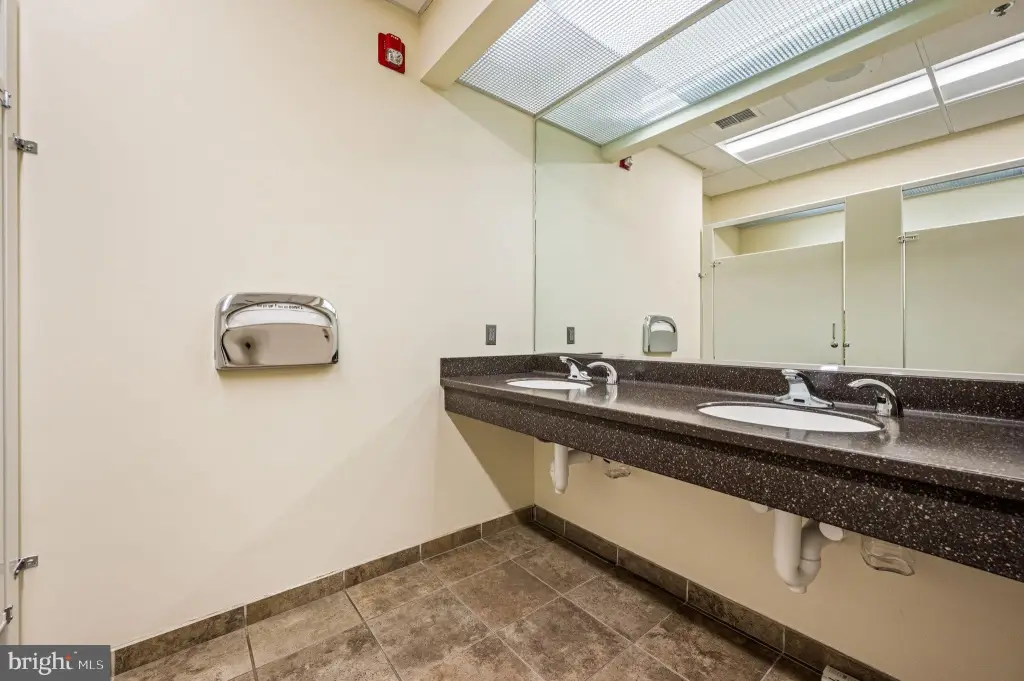
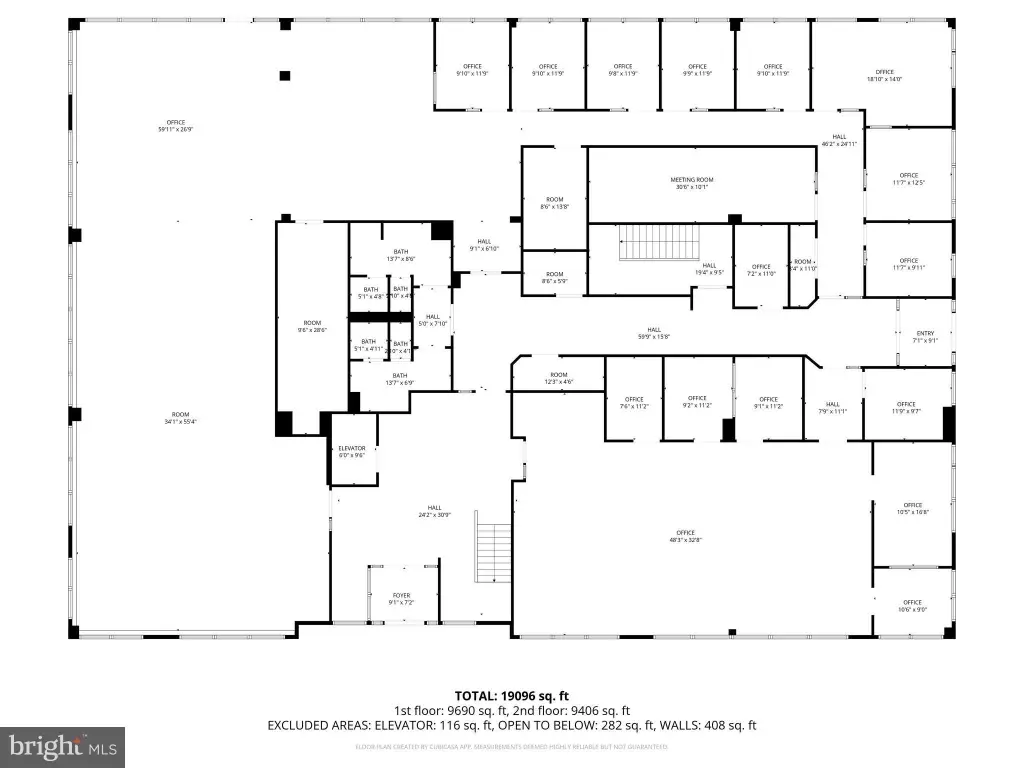
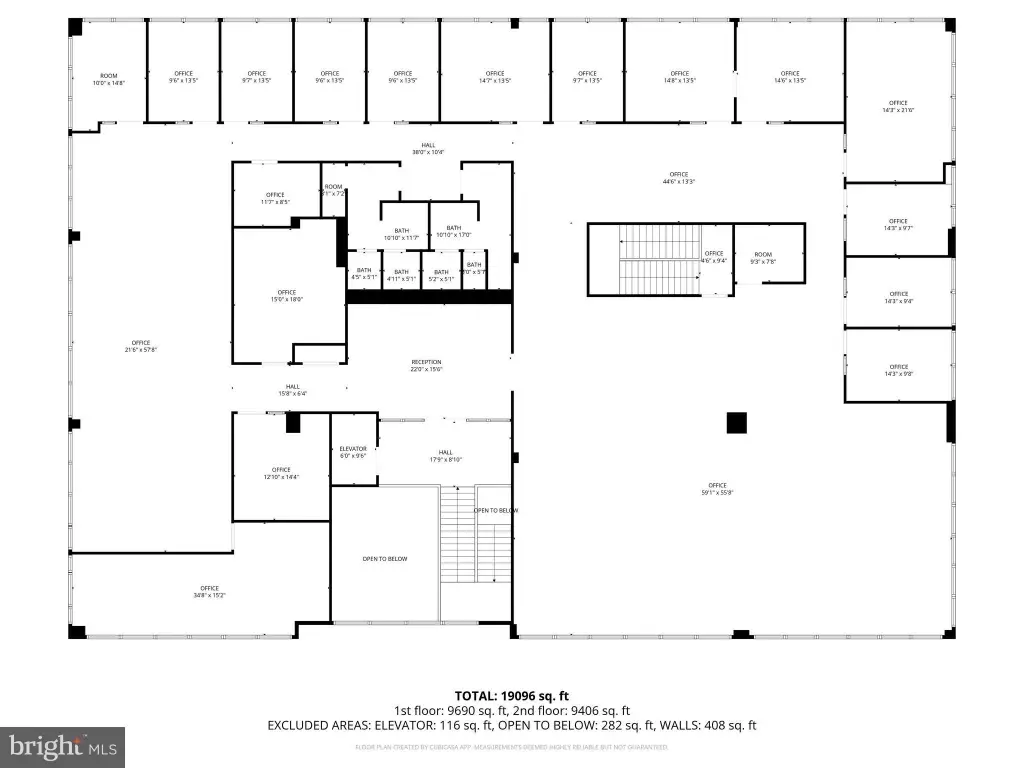
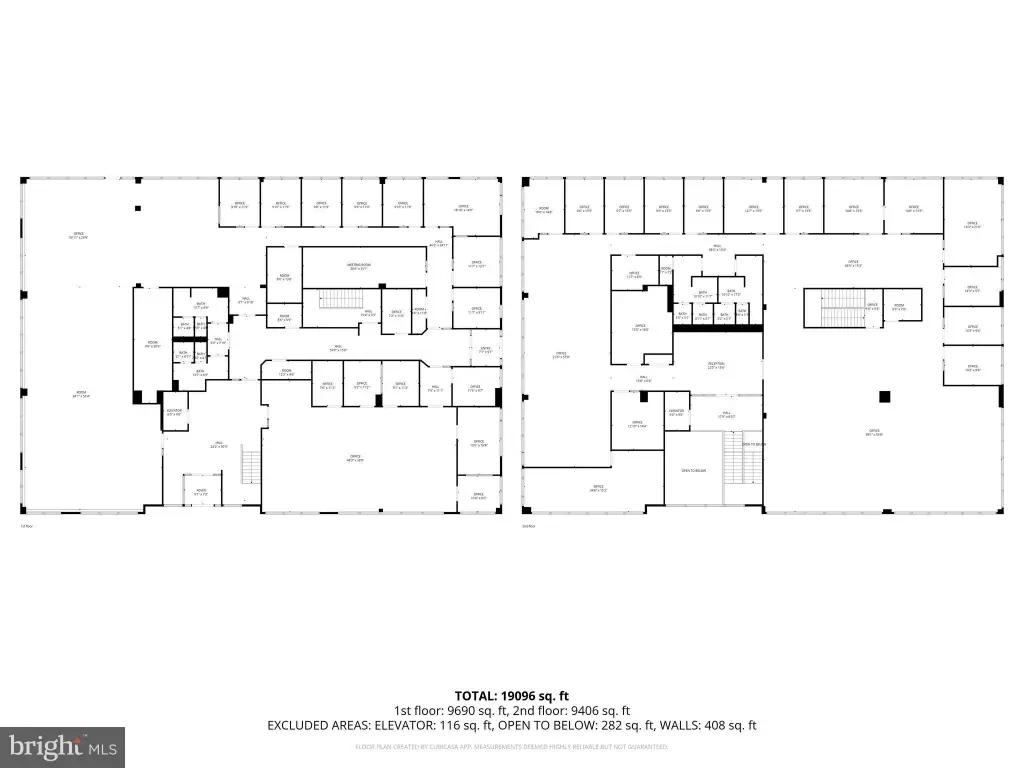
This standalone office property is offered vacant and includes a mix of perimeter executive offices, open-plan work areas, and a second-floor reception area. Building systems include 600 AMP 3-phase power, a full-building Cummins backup generator, fiber-optic connectivity, central air, forced-air heating, and elevator accessibility. The property was built in 2006 and includes 100 dedicated surface parking spaces across a 2.6-acre site.
Positioned along the Route 3 corridor at 1645 W Chester Pike, the property has frontage exposure to approximately 31,000 vehicles per day. Its R-3 Residential-Office zoning supports corporate and professional, medical and wellness, and institutional or community uses, subject to township approval. The site provides access to regional thoroughfares connecting West Chester, Newtown Square, and Greater Philadelphia.
Positioned along the Route 3 corridor at 1645 W Chester Pike, the property has frontage exposure to approximately 31,000 vehicles per day. Its R-3 Residential-Office zoning supports corporate and professional, medical and wellness, and institutional or community uses, subject to township approval. The site provides access to regional thoroughfares connecting West Chester, Newtown Square, and Greater Philadelphia.
Key Highlights
- Vacant standalone office property built in 2006
- 2.6‑acre site with 100 dedicated surface parking spaces
- 600 AMP 3‑phase power and full‑building Cummins backup generator
Financial Insights
Estimated NOI and Cap Rate
NOI / Yr
$314,433
Cap Rate
6.29%
Suggested Prices Based on Cap Rates
Cap Rate 5%
$6,288,660
$6.3M
Cap Rate 7%
$4,491,900
$4.5M
Cap Rate 9%
$3,493,700
$3.5M
Market Conditions
NOI Build-Up for 20,000 SF
Gross rent
$520.8K $26.04/SF
− Vacancy
−$101.6K −$5.08/SF
EGI
$419.2K $20.96/SF
− OpEx
−$104.8K −$5.24/SF
NOI
$314.4K $15.72/SF
Area
Chester County, PA
Vacancy
19.50%
Lease Rate
$26.04 /SF/Yr
Expense Ratio
25.00%
Simulate Cap Rate and NOI
Suggested Prices Based on Cap Rates
Cap Rate 5%
$6,288,660
Cap Rate 7%
$4,491,900
Cap Rate 9%
$3,493,700
Alternative Uses
Best Use
Office B
$4.49M
$3.93M – $5.24M
NOI $314,433 @ 7.0% cap · market cap 6.29%
Second Best
—
—
no second resolved use
Theoretical Best
Office A
$6.06M
$5.31M – $7.07M
NOI $424,466 @ 7.0% cap · market cap 8.49%
Zoning and permitted uses should be independently verified with authorities.
How Realmo checks its estimates
Property Analytics
Unlock full access to Insights
Subscribe to Realmo Intelligence
Open Analytics
Current Use
Lease Details
Yes
Paved road access
Yes
Utilities to site
Location Intelligence
Trade Area within ½ mile
245
Businesses Nearby
Explore this area
Business Placement
Demographics for 19382, PA
52,498
Population
21,798
Households
2.4
Avg Household Size
40
Median Age
64%
College-Educated
98%
High-School Grad
46.1 sq mi
ZIP Area
1,139
Density / Sq Mi
$126,159
Median Household Income
$58,596
Median Earnings
$1,788
Median Rent
$542,400
Median Home Value
Check the figures for this property
Cap Rate, Value Estimation, Potential NOI and more
View Realmo Analytics
Market
Vacancy Rate% for Office in Northeast region

Questions? Ask Rey
Realmo’s AI knows this listing — price, zoning, demand, history. Ask anything.


Frequently Asked Questions
What type of property is this?
Office building - Vacant office facility with executive offices, open-plan work areas, elevator access, and comprehensive building infrastructure.
Where is this office building located?
The property is located at 1645 W CHESTER Pike West Chester, PA.
What is the asking price?
The asking price for this property is $5,000,000.
What are key features of this property?
This property features: Vacant standalone office property built in 2006; 2.6‑acre site with 100 dedicated surface parking spaces; 600 AMP 3‑phase power and full‑building Cummins backup generator


