Auto Body and Convenience
For Sale
$895,000
163 Crescent St, Brockton, MA 02302
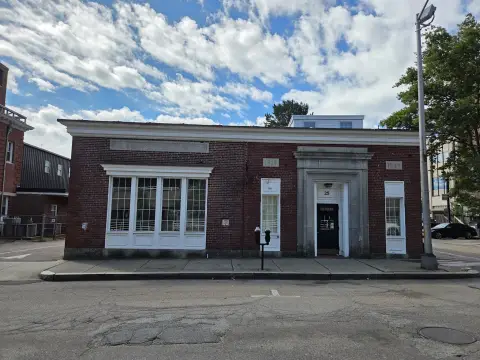
Two leased spaces include an auto body shop with spray booth and lifts plus a convenience store.
Property Size4,495 SF
Price / SF$199.11
Days on Market238
Property Features for 163 Crescent St
General Information
Standard status
Active
Size
4,495 SF
Property subtype
Commercial
Zoning
C2
Additional Details
Business Included
Yes
Service Bays
2
Taxes and HOA fees
Annual Taxes
$8,739
Building Details
Year Built
1935
Tenancy
Multi
Listing Agency:
REMAX Executive Realty
(508) 520-9696
Listed By:
Casey Killam · License #9515907-RE-S
(774) 287-2084
Source:
Churchillprop
Added: Feb 23
Changed: Oct 6
Last Checked: Oct 19 at 3:51AM
Displayed information is deemed reliable but is not guaranteed and should be independently verified. All listing content including descriptions, pricing, images are the copyrighted material of REMAX Executive Realty

Ask AI about this property
Review the available facts, identify missing information and prepare questions for the agent.
Investment Insights
Based on property information with market context.
This property includes a well-established auto body/auto repair business with the purchase, as the owner is retiring. The auto body space features a spray booth, two lifts, bathroom, reception, office, mezzanine storage space, and additional supporting improvements. The convenience store provides separate retail space within the same property.
Located on busy Crescent Street in Brockton, the site combines auto service operations and a convenience store tenant for ongoing cash flow. The auto body space totals 2,295 sf, with the convenience store space at 2,200 sf.
The overall configuration supports two distinct functions under one ownership: automotive repair activities in the dedicated shop area and convenience retail in the adjoining tenant space.
Located on busy Crescent Street in Brockton, the site combines auto service operations and a convenience store tenant for ongoing cash flow. The auto body space totals 2,295 sf, with the convenience store space at 2,200 sf.
The overall configuration supports two distinct functions under one ownership: automotive repair activities in the dedicated shop area and convenience retail in the adjoining tenant space.
Key Highlights
- Two leased spaces totaling 4,495 SF: 2,295 SF auto body shop and 2,200 SF convenience store
- Auto body shop includes a spray booth and two lifts
- Includes reception, office, bathroom, and mezzanine storage space
Financial Insights
Estimated NOI and Cap Rate
NOI / Yr
$77,127
Cap Rate
8.62%
Suggested Prices Based on Cap Rates
Cap Rate 5%
$1,542,540
$1.5M
Cap Rate 7%
$1,101,814
$1.1M
Cap Rate 9%
$856,967
$857.0K
Market Conditions
NOI Build-Up for 4,495 SF
Gross rent
$110.6K $24.60/SF
− Vacancy
−$7.7K −$1.72/SF
EGI
$102.8K $22.88/SF
− OpEx
−$25.7K −$5.72/SF
NOI
$77.1K $17.16/SF
Area
Brockton, MA
Vacancy
7.00%
Lease Rate
$24.60 /SF/Yr
Expense Ratio
25.00%
Simulate Cap Rate and NOI
Suggested Prices Based on Cap Rates
Cap Rate 5%
$1,542,540
Cap Rate 7%
$1,101,814
Cap Rate 9%
$856,967
Alternative Uses
Best Use
Specialty Retail
$1.10M
$964.1K – $1.29M
NOI $77,127 @ 7.0% cap · market cap 8.62%
Second Best
Retail
$913.1K
$798.9K – $1.07M
NOI $63,915 @ 7.0% cap · market cap 7.14%
Theoretical Best
Office A
$2.14M
$1.87M – $2.49M
NOI $149,651 @ 7.0% cap · market cap 16.72%
Zoning and permitted uses should be independently verified with authorities.
How Realmo checks its estimates
Property Analytics
Unlock full access to Insights
Subscribe to Realmo Intelligence
Open Analytics
Current Use
Lease Details
2
Service bays
Multi-tenant
Tenancy
Turnkey business
Opportunity
Location Intelligence
Trade Area within ½ mile
1,665
Businesses Nearby
47k
Monthly Visits Nearby
Well-served
Demand for This Use
Explore this area
Business Placement
Foot Traffic Nearby
Shops & Services 68%
Dining 24%
Home Improvements & Furnishings 5%
Electronics 3%
Cumberland Farms
Shops & Services
17,060 visits/mo
0.4 miles
Dunkin' Donuts
Dining
9,948 visits/mo
0.2 miles
Family Dollar
Shops & Services
8,692 visits/mo
0.5 miles
Irving's Home Center
Home Improvements & Furnishings
2,266 visits/mo
0.4 miles
Laundry Time
Shops & Services
2,202 visits/mo
0.5 miles
Demographics for 02302, MA
36,202
Population
12,828
Households
2.8
Avg Household Size
38
Median Age
21%
College-Educated
83%
High-School Grad
8.9 sq mi
ZIP Area
4,068
Density / Sq Mi
$87,560
Median Household Income
$45,342
Median Earnings
$1,476
Median Rent
$395,000
Median Home Value
Check the figures for this property
Cap Rate, Value Estimation, Potential NOI and more
View Realmo Analytics
Market
Vacancy Rate% for Retail in Northeast region




Similar Off Market Nearby
- Forest Ave. Auto — 210 Forest Ave, Brockton, MA 02301
- Country Autobody — 743 Warren Ave, Brockton, MA 02301
- Black Ops Collision Repair — 761 Warren Ave, Brockton, MA 02301
- A & B Auto Body Repair — 649 Warren Ave, Brockton, MA 02301
- Art's Auto & Marine — 736 Warren Ave, Brockton, MA 02301
Frequently Asked Questions
What type of property is this?
Auto shop - Two leased spaces include an auto body shop with spray booth and lifts plus a convenience store.
Where is this auto shop located?
The property is located at 163 Crescent St Brockton, MA.
What is the asking price?
The asking price for this property is $895,000.
What are key features of this property?
This property features: Two leased spaces totaling 4,495 SF: 2,295 SF auto body shop and 2,200 SF convenience store; Auto body shop includes a spray booth and two lifts; Includes reception, office, bathroom, and mezzanine storage space


