Four-Unit Quadplex with
For Sale
$1,999,999
163/165 Lincoln Avenue, Rockville Centre, NY 11570
Residential Income, Rockville Centre, NY
Property SizeContact for details
Lot Size0.51 Acres
Days on Market99
Property Features for 163/165 Lincoln Avenue
General Information
Property type
Residential Multi Family
Property subtype
Duplex
Bedrooms
4
Bathrooms
4
Full bathrooms
4
Rooms
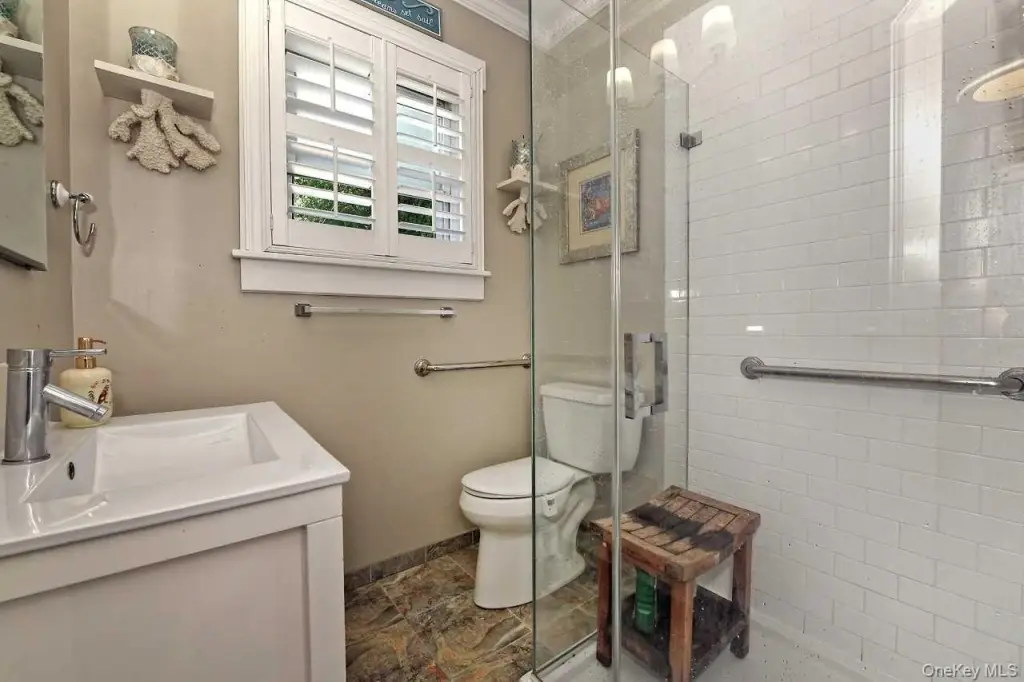
Bathroom 1, Bedroom 3, Bedroom 2, Bathroom 2, Bathroom 3, Basement, Bathroom 4, Bedroom 4, Bedroom 1
Parking
10
Parking features
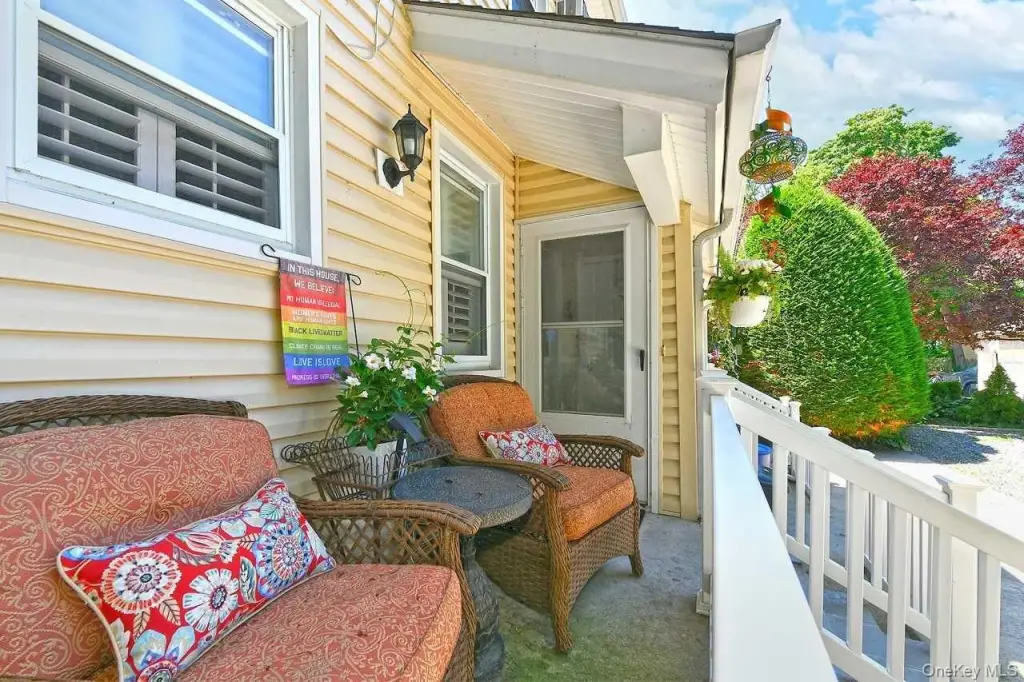
Parking Lot, Garage, Driveway
Patio and Porch features
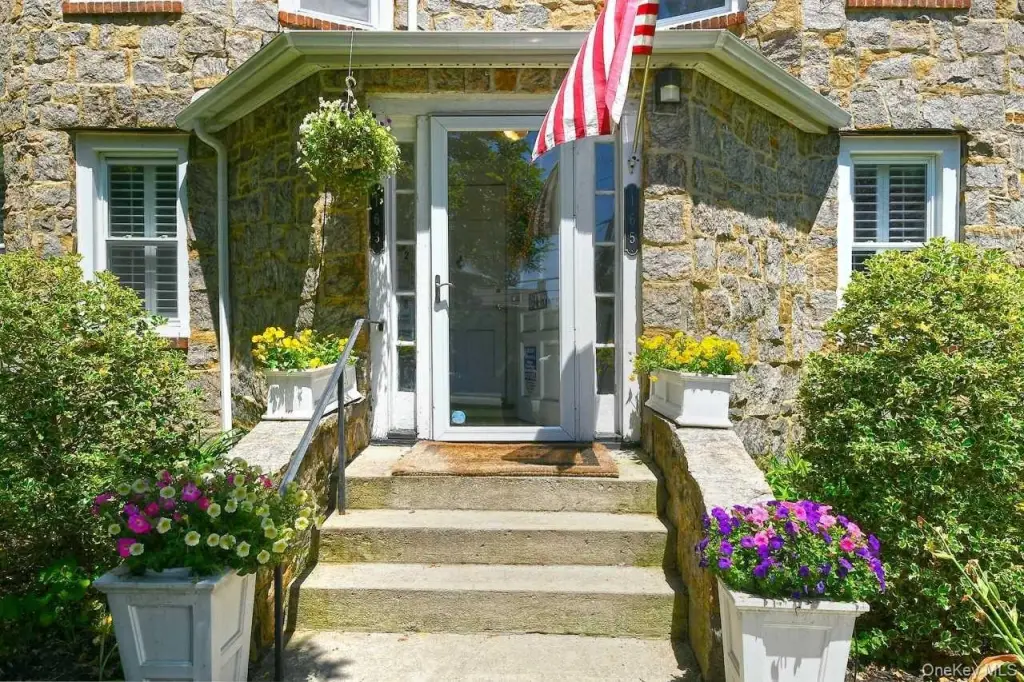
Porch
Interior features
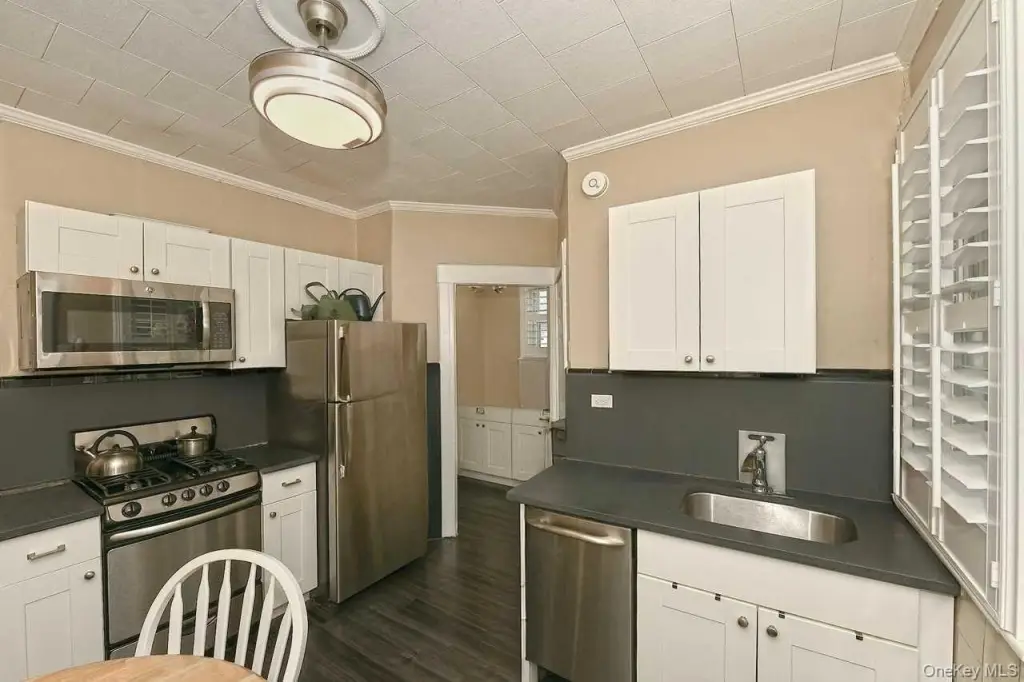
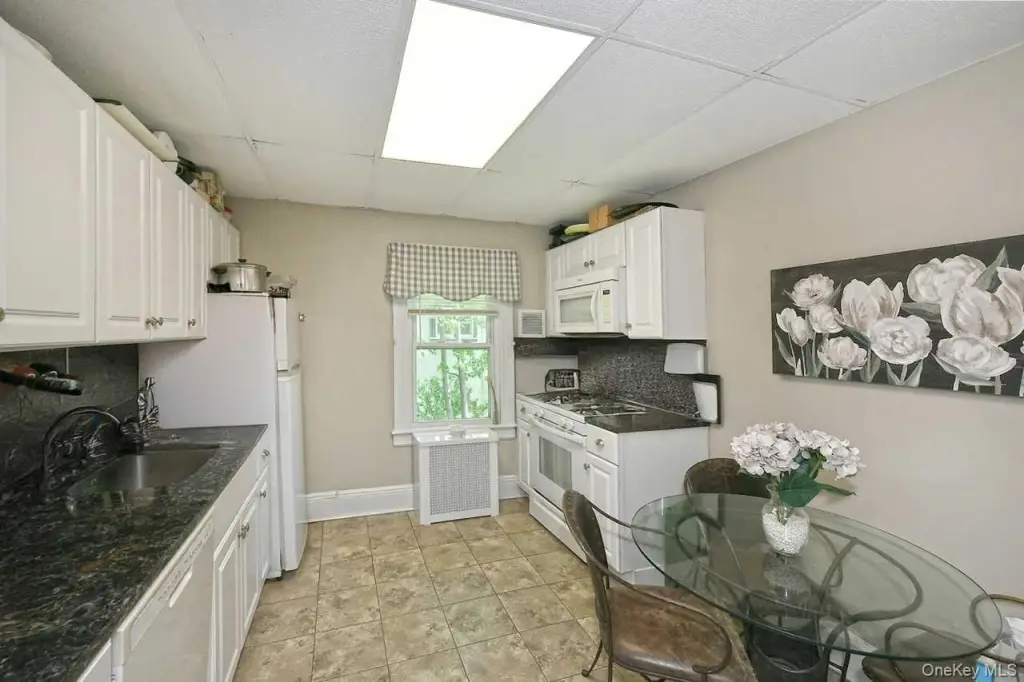
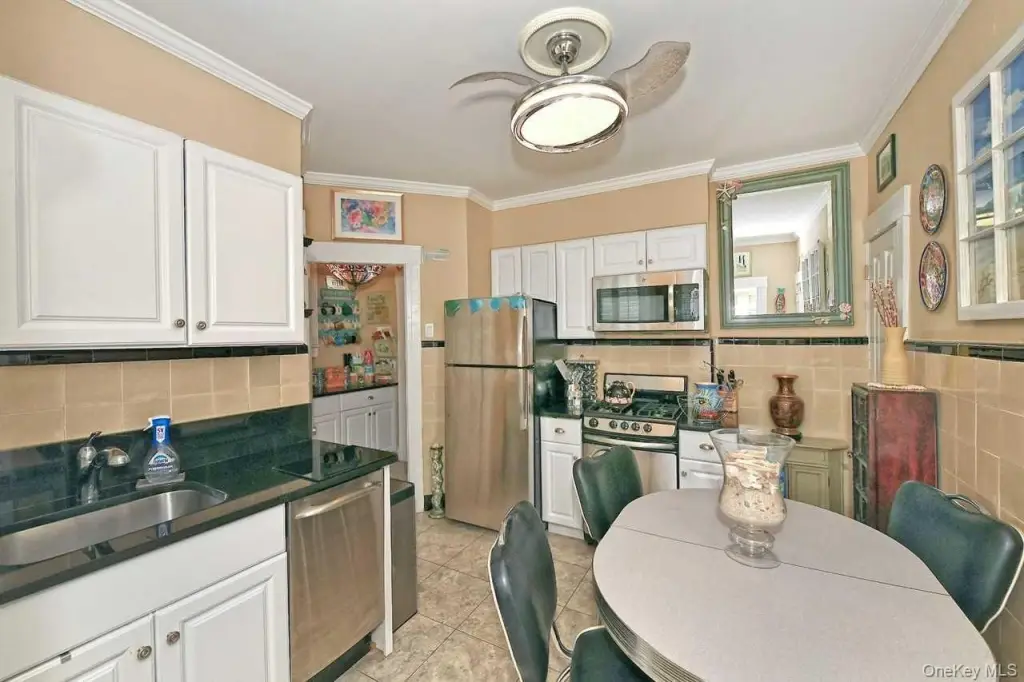
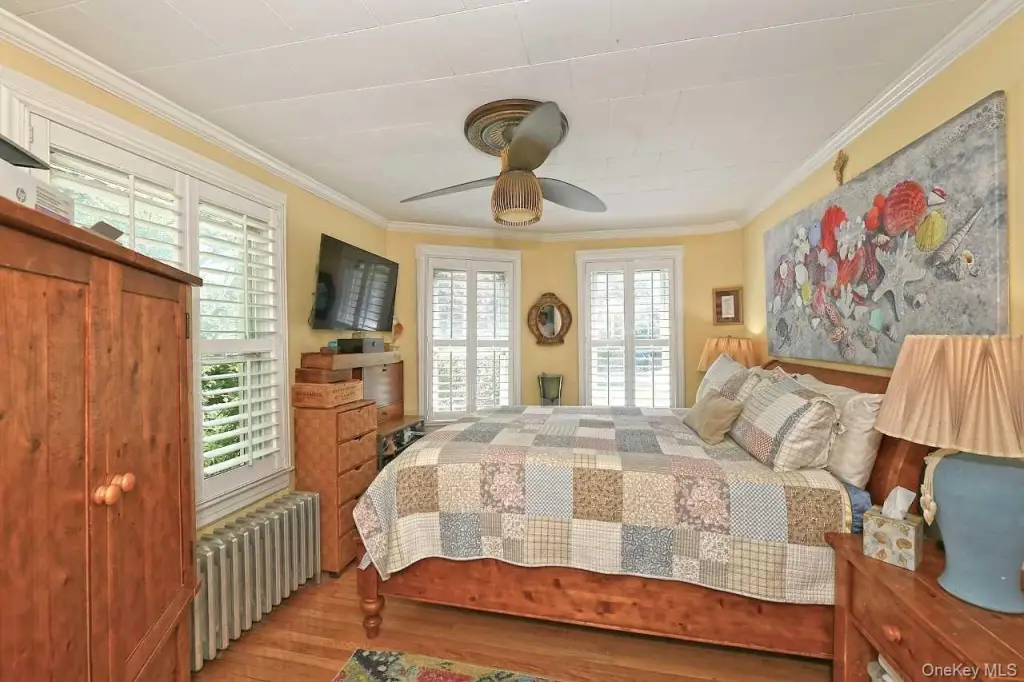
First Floor Bedroom, First Floor Full Bath, Ceiling Fan(s), Chandelier, Crown Molding, Eat-in Kitchen, Granite Counters, Pantry
Exterior features
Mailbox, Rain Gutters
Fireplace
1
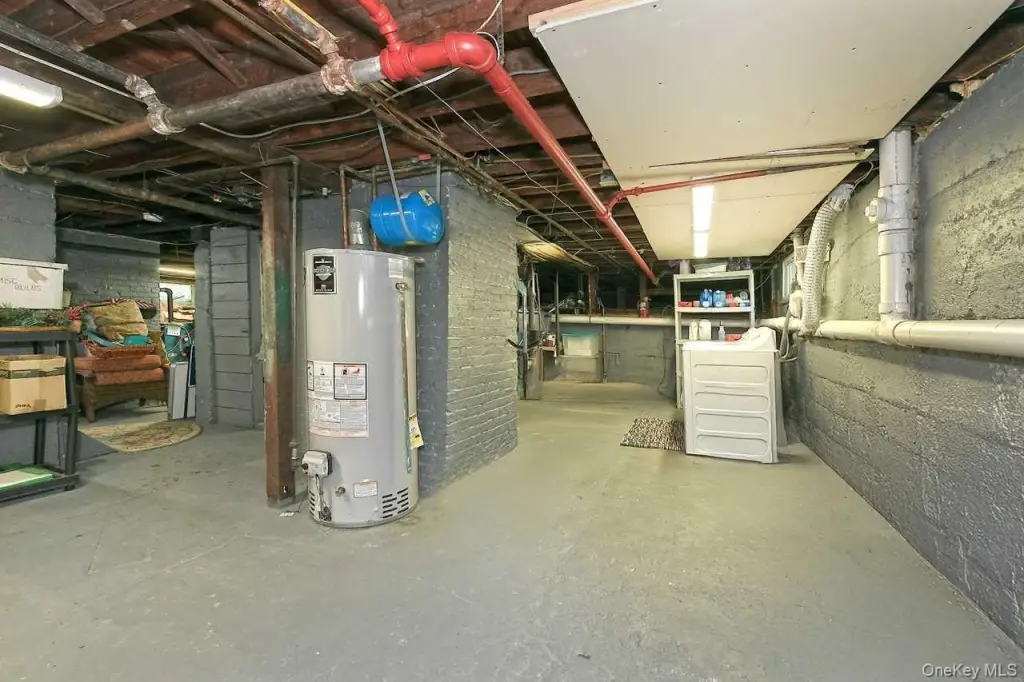
Basement
Unfinished, Crawl Space, Partial
Lot features
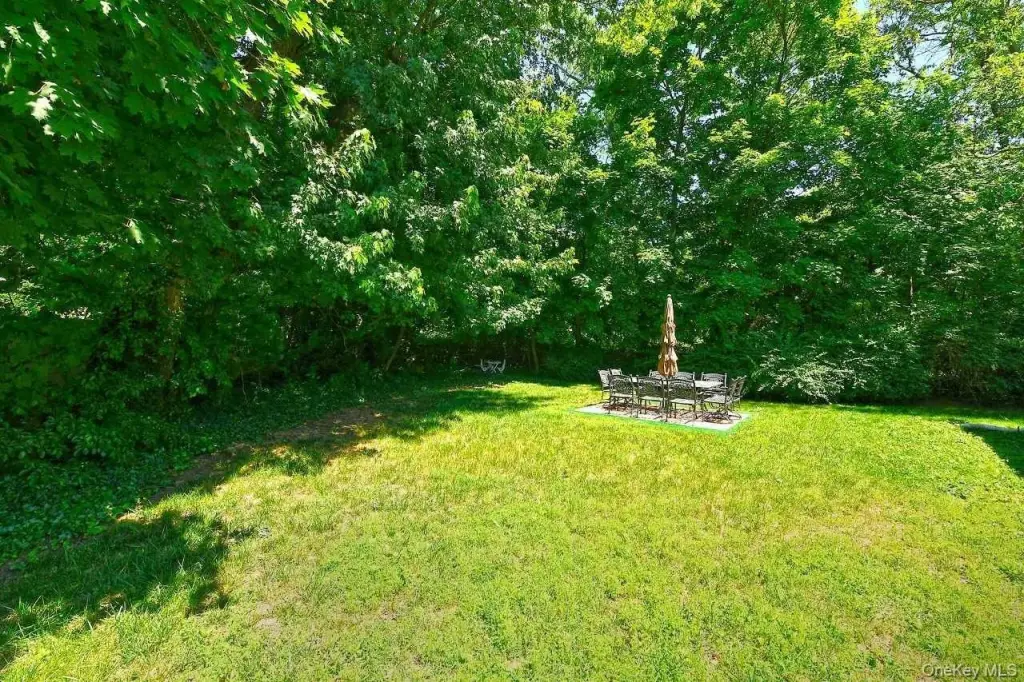
Back Yard, Irregular Lot, Landscaped, Level, Near Public Transit, Near School, Near Shops, Private, Sprinklers In Front
Elementary school
School 2
Middle school
School 9M-Oceanside Middle School
High school
School 7-Oceanside Senior Hs
Elementary school district
Oceanside
Middle school district
Oceanside
High school district
Oceanside
Directions
South on S. Park Ave, Left on Lincoln Ave
Standard status
Active
APN
2029-38-323-00-0131-0 and 38-323_00_0132_0
Lot size
0.51 Acres
Taxes and HOA fees
Tax Year
2026
Tax Annual Amount
26076
Utilities
Utilities
Cable Available
Sewer type
Public Sewer
Heating system
Natural Gas
Cooling system
Wall/Window Unit(s), Window Unit(s)
Water source
Public
Amenities
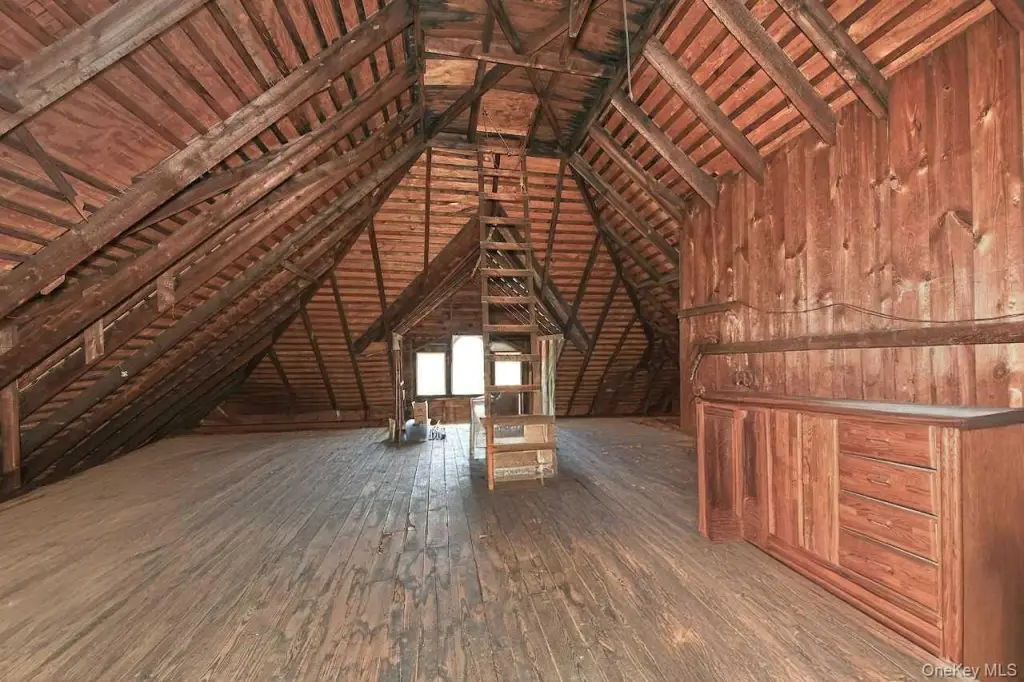
shared unfinished attic storage
shared laundry facilities
butler pantry
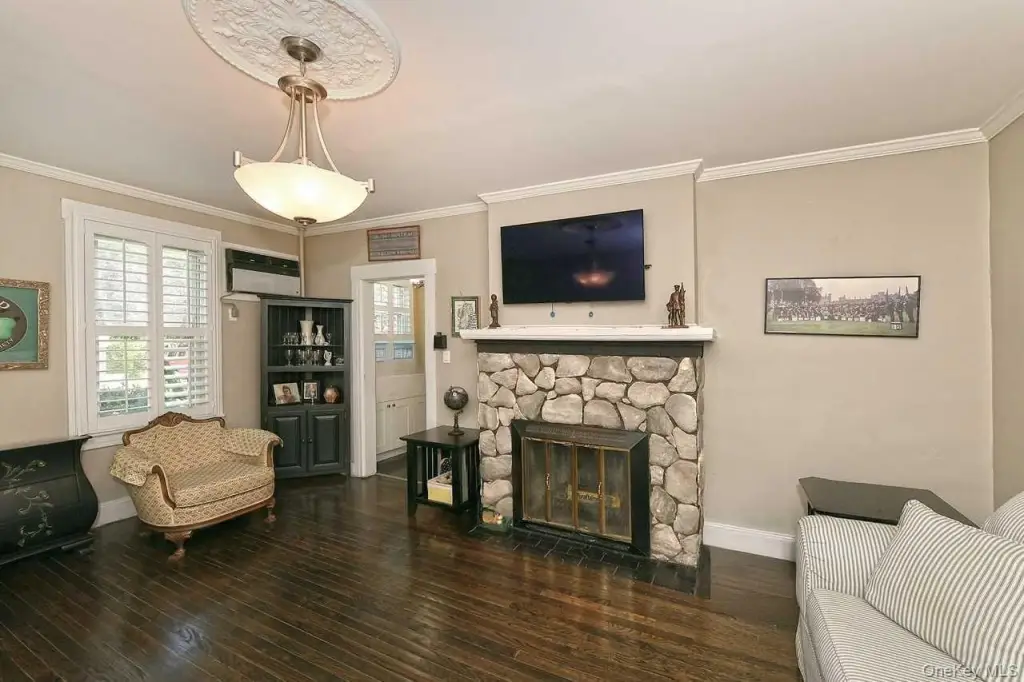
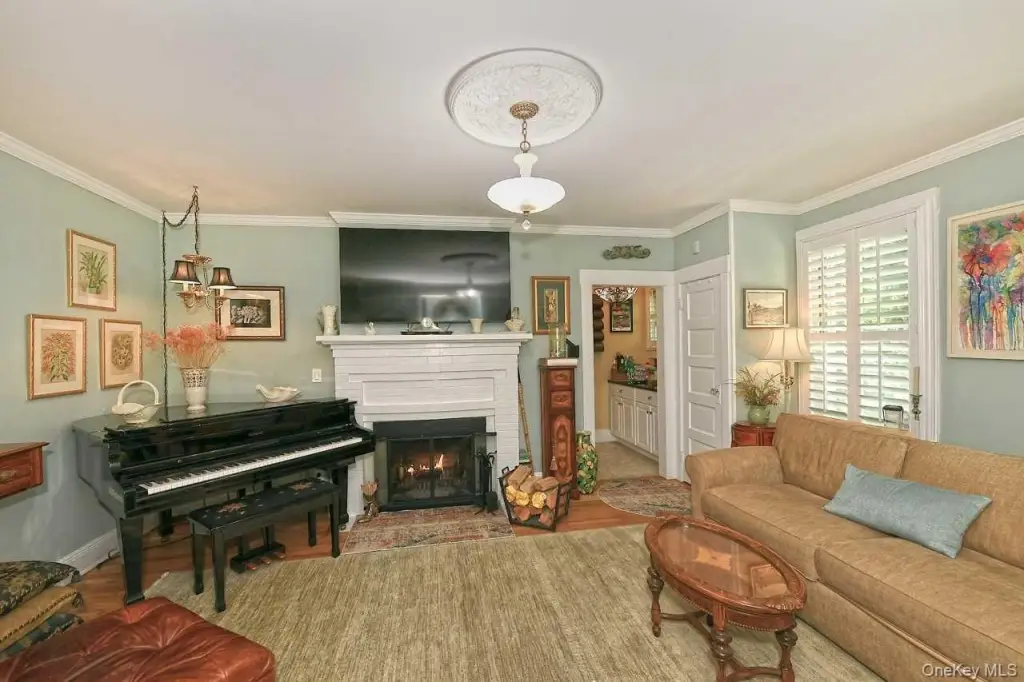
wood burning fireplace
outdoor recreation area
Building Details
Year built
1920
Number of units
4
Building materials
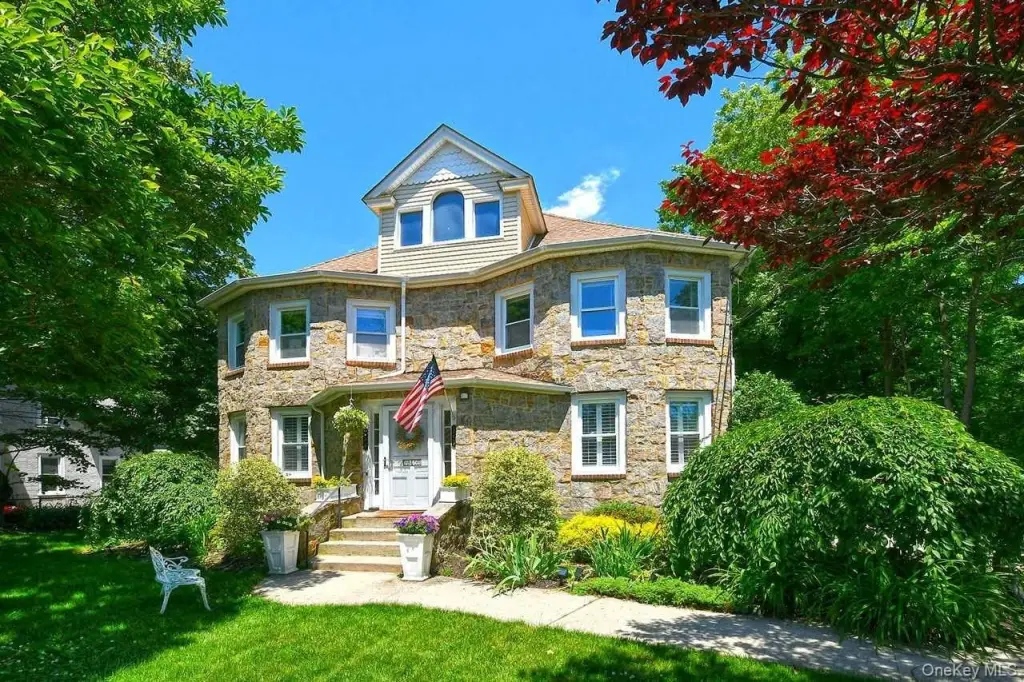
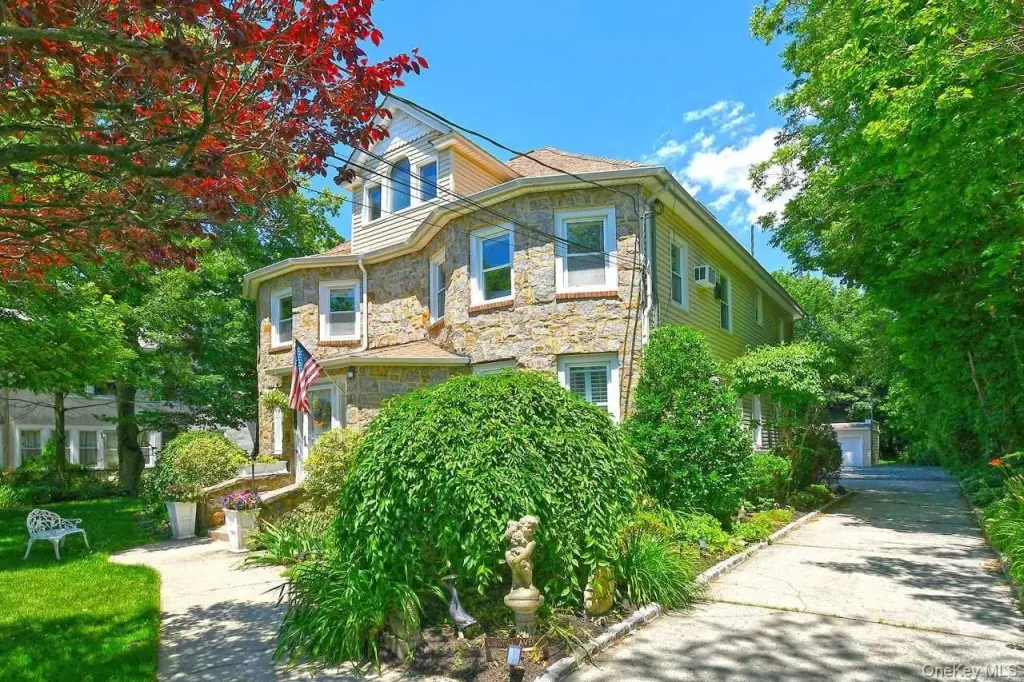
Block, Stone, Vinyl Siding
Architectural style
Colonial
Listing Agency:
Signature Premier Properties
(516) 546-6300
Listed By:
George Haase
(516) 647-4813
Added: Jun 18
Changed: Sep 18
Last Checked: Sep 24 at 7:06AM
MLS# 1013918
Copyright © 2026 OneKey MLS. All rights reserved. All information provided by the listing agent/broker is deemed reliable but is not guaranteed and should be independently verified.
Investment Insights
Based on property information with market context.
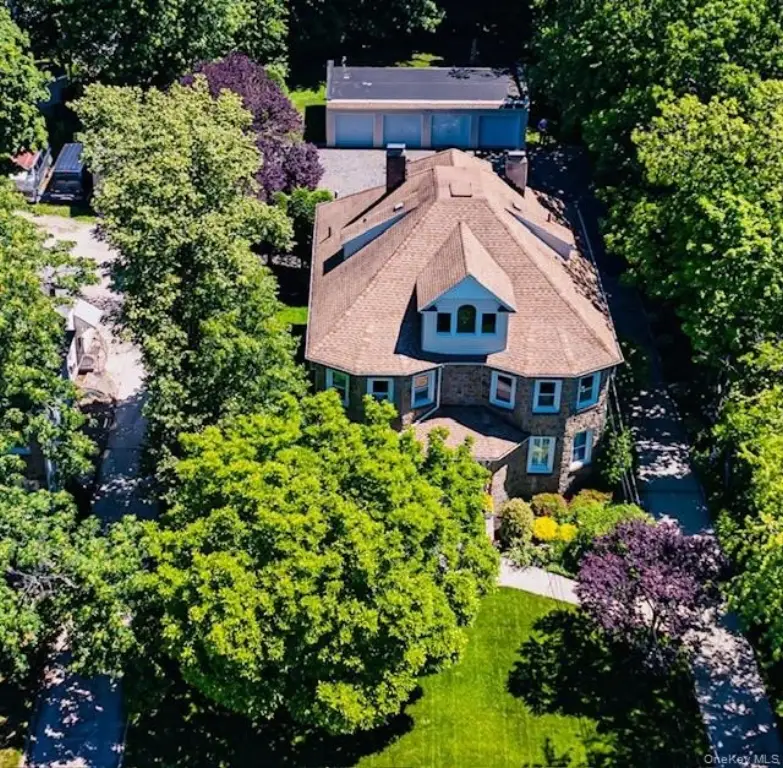
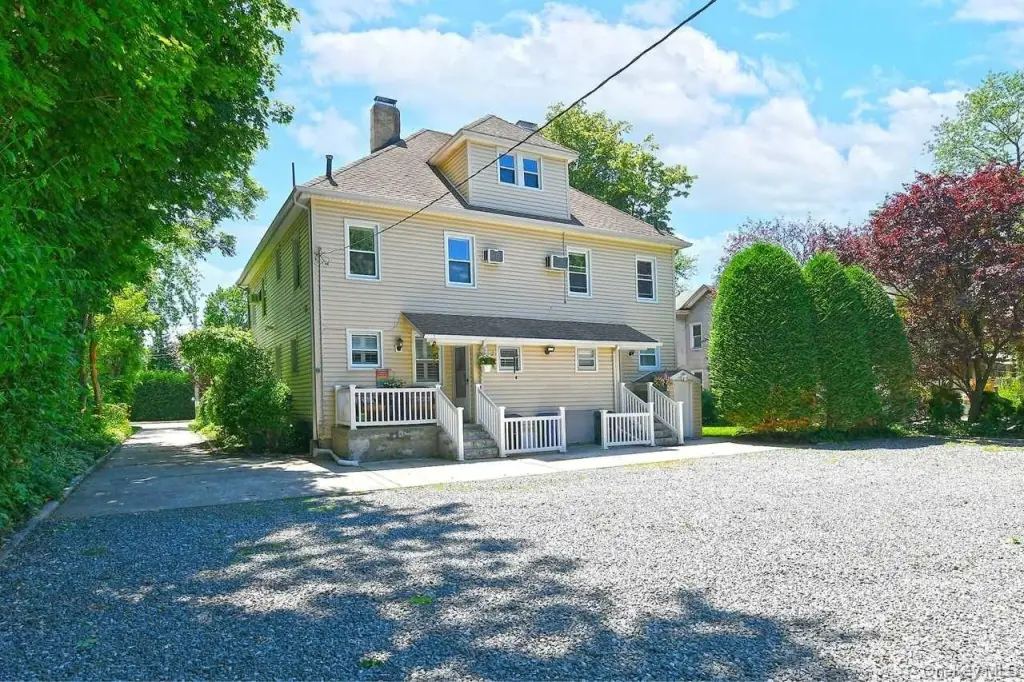
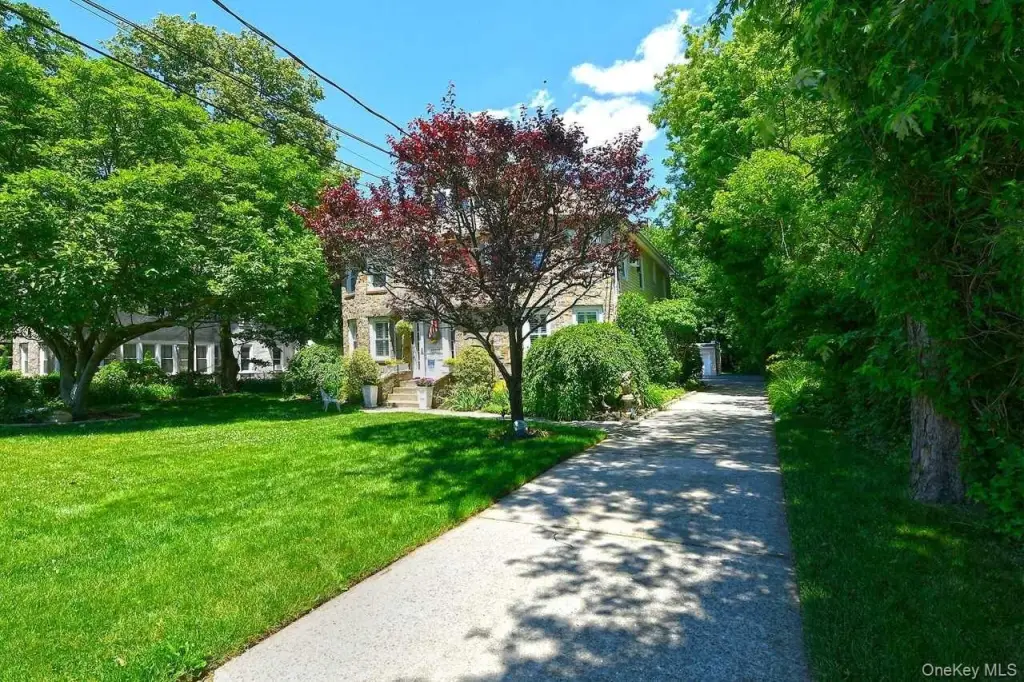
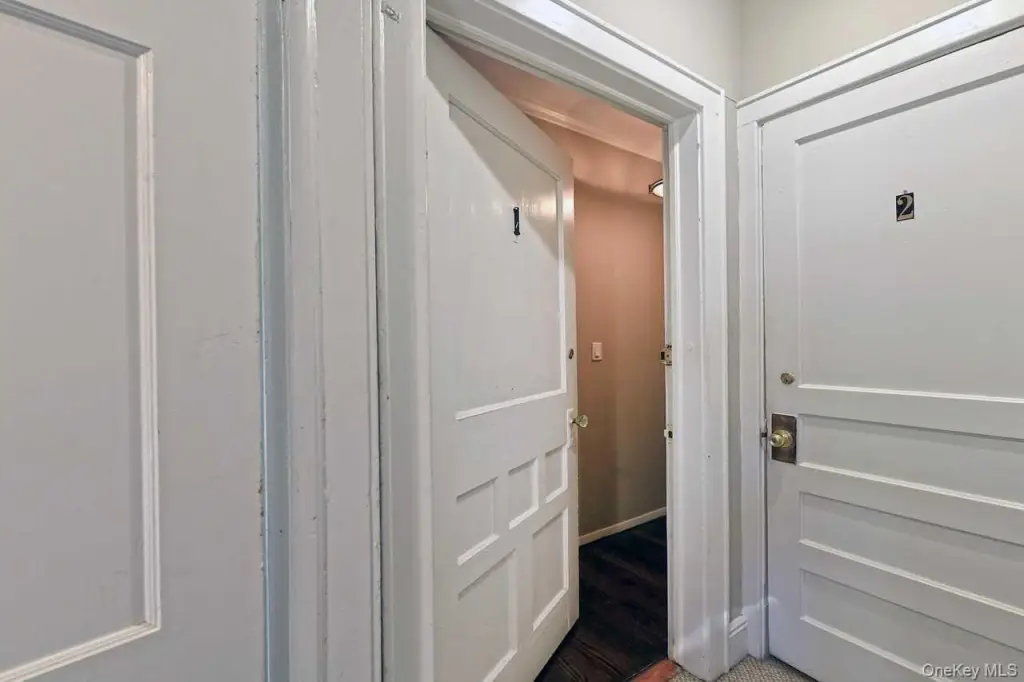
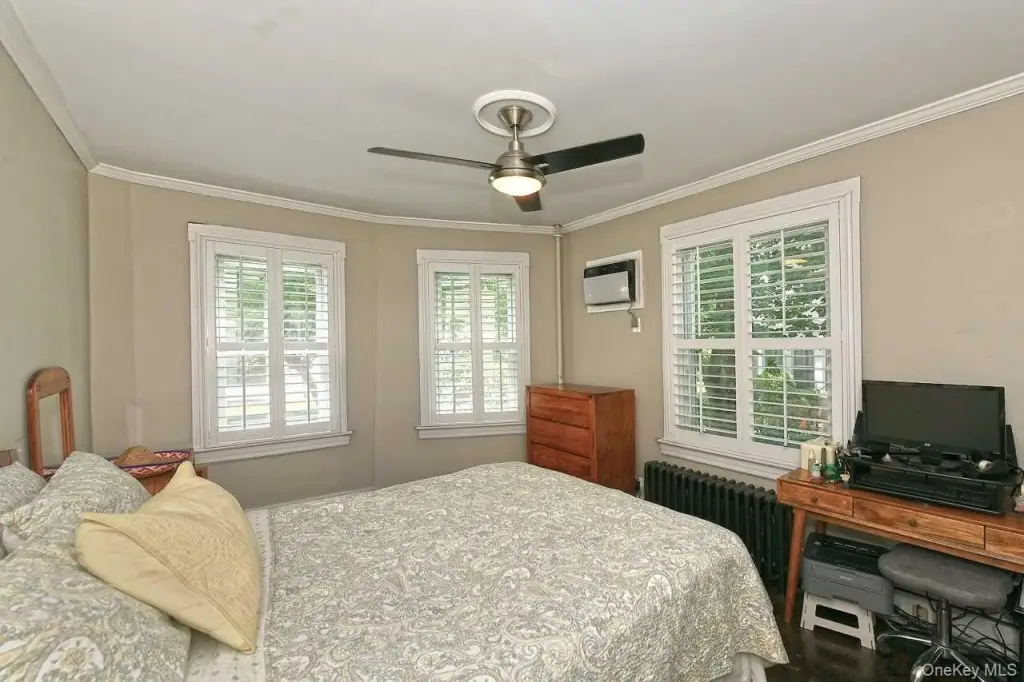
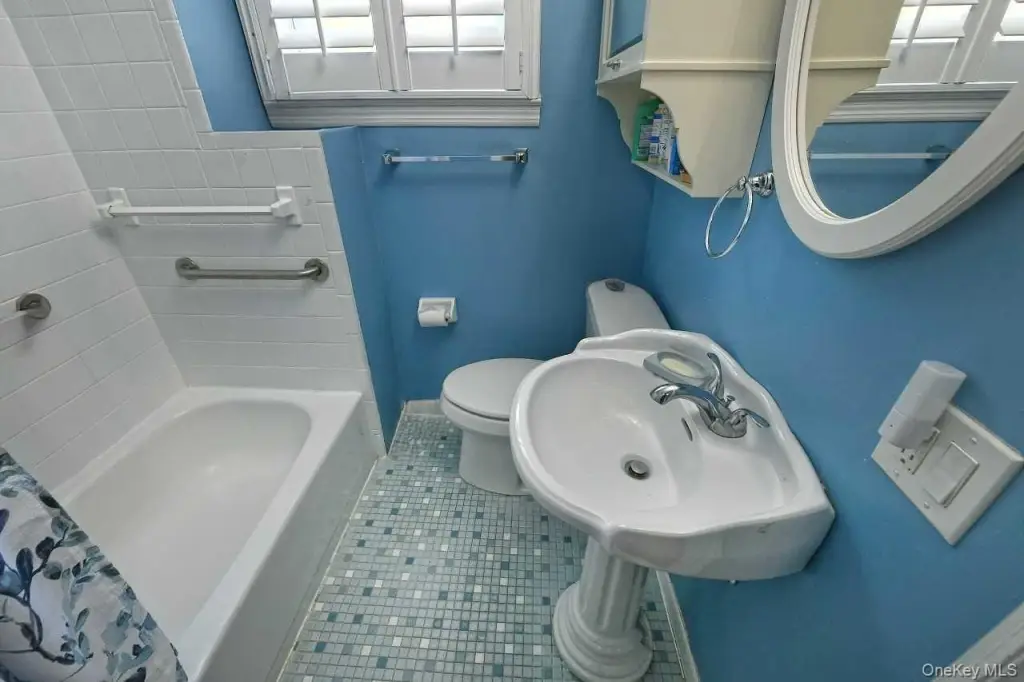
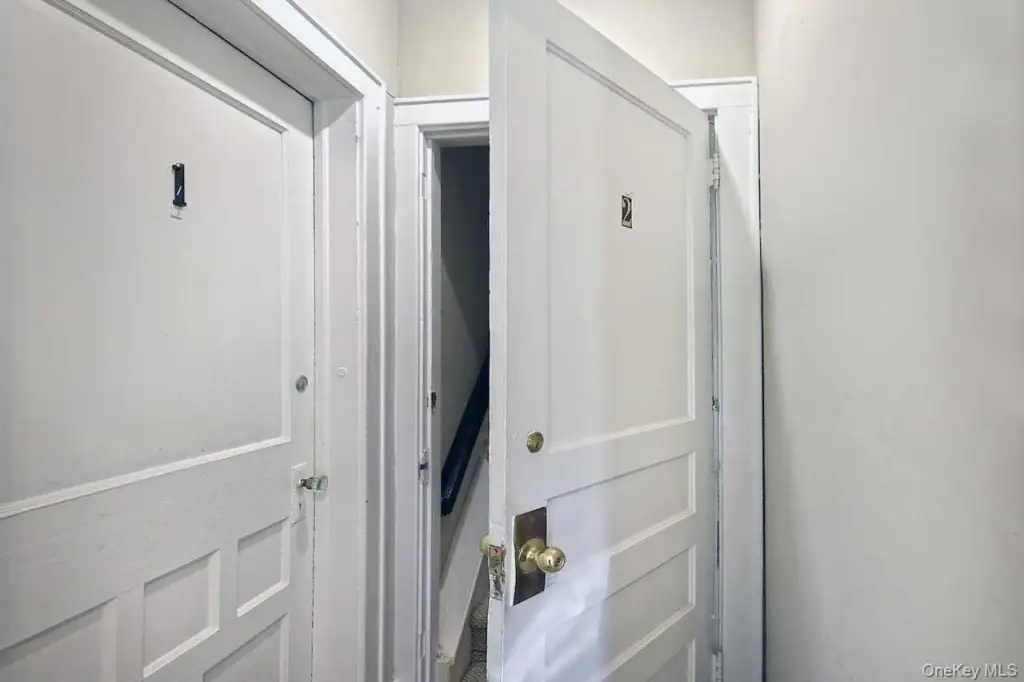
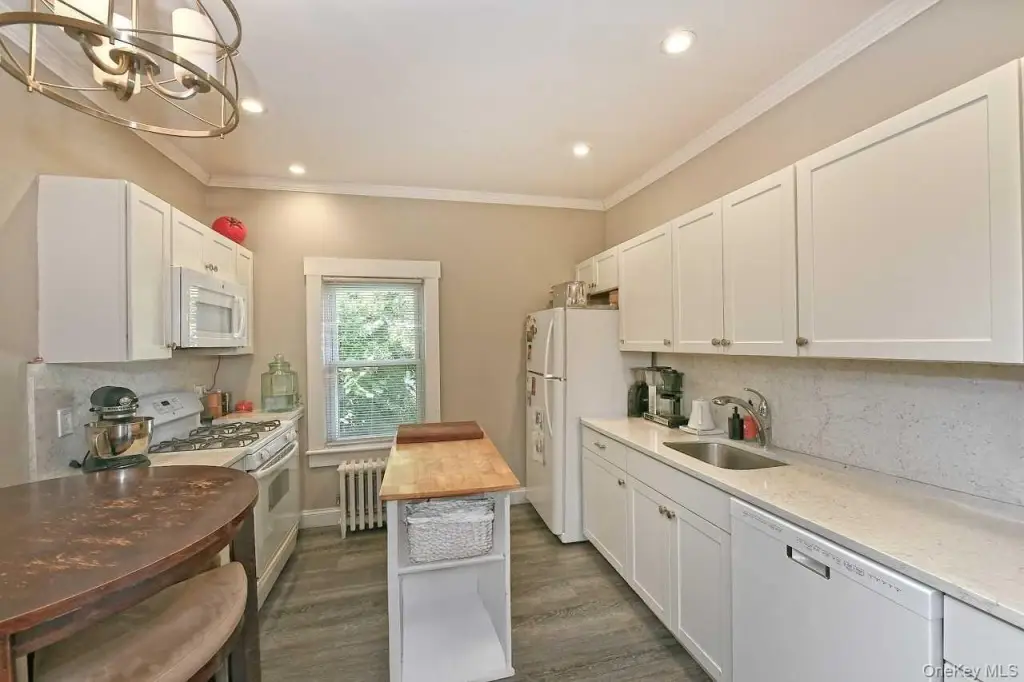
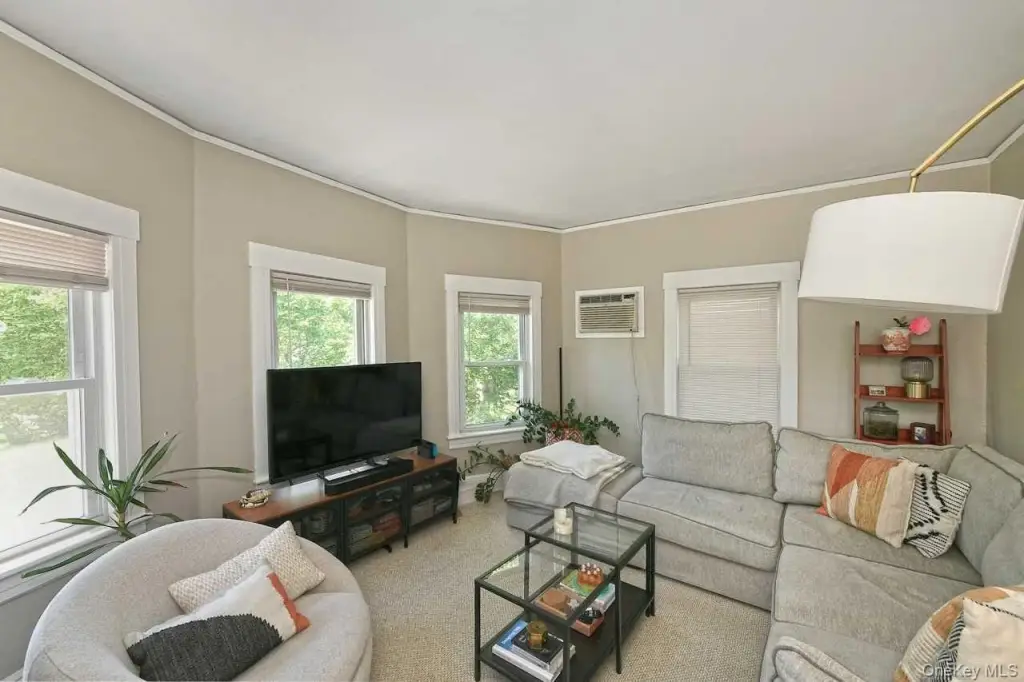
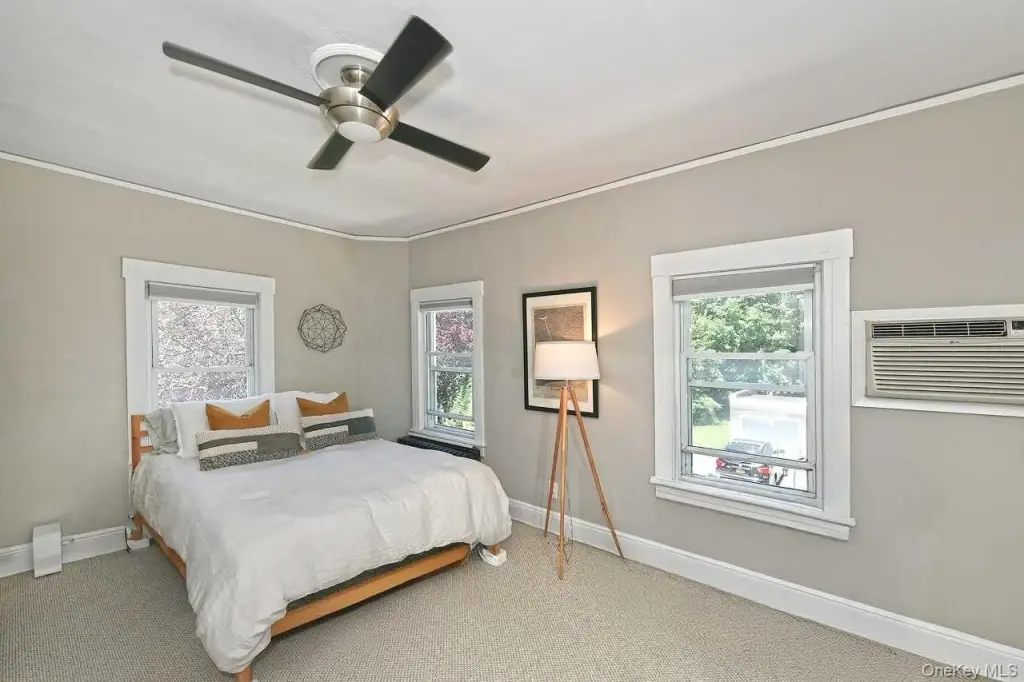
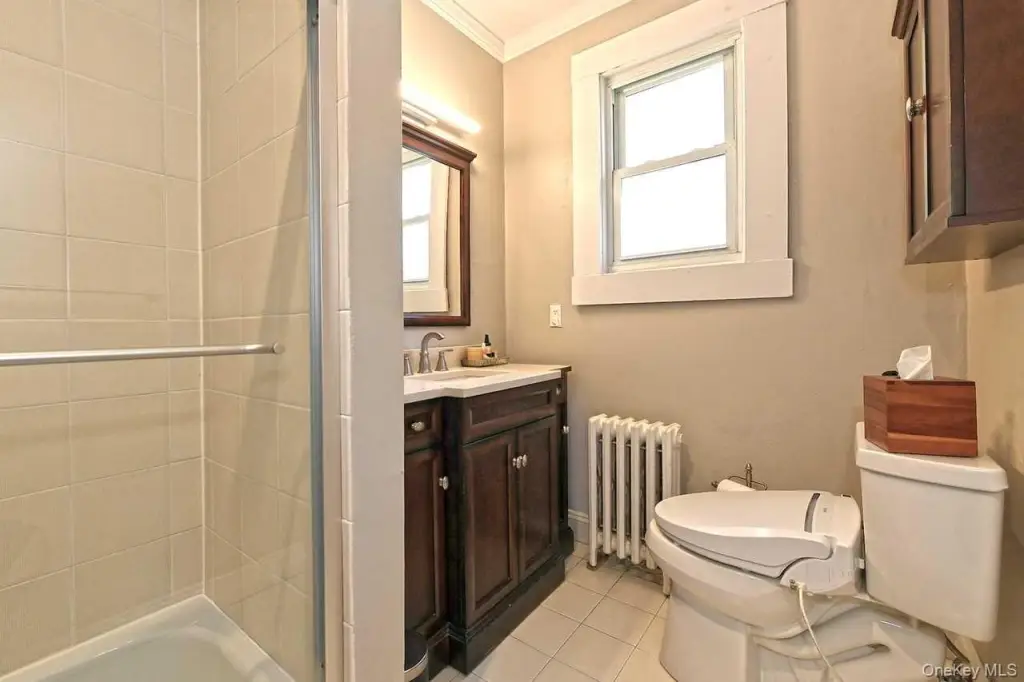
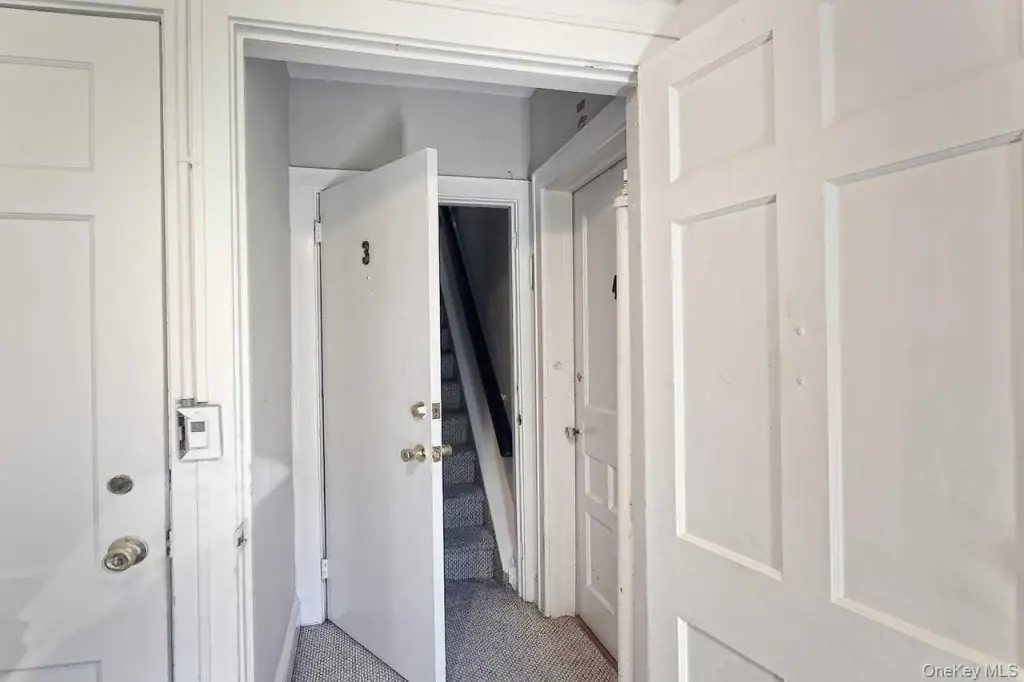
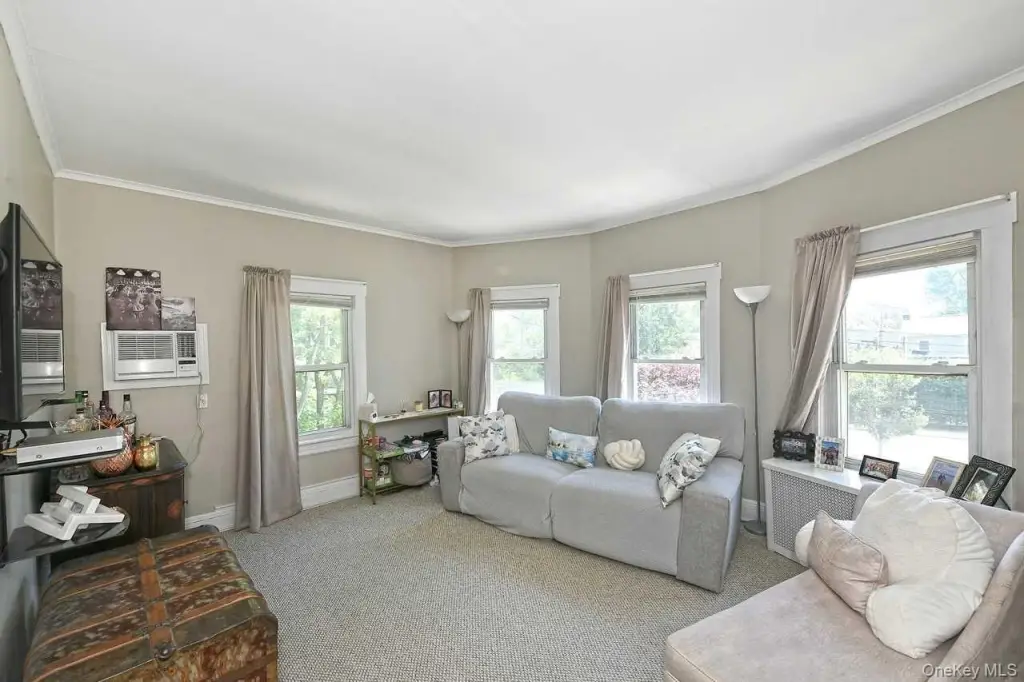
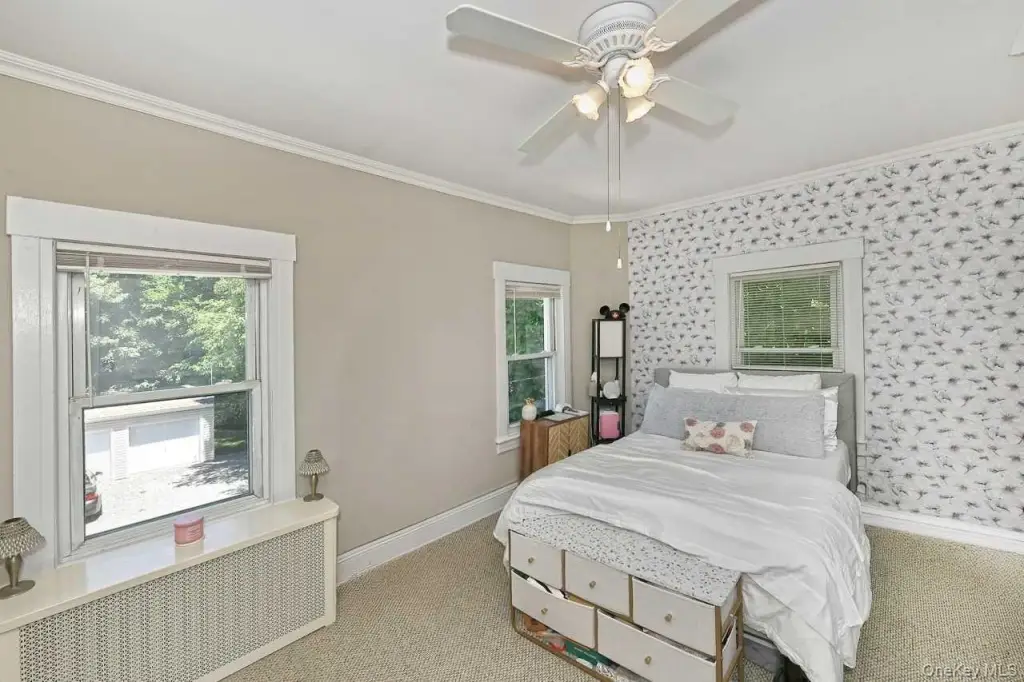
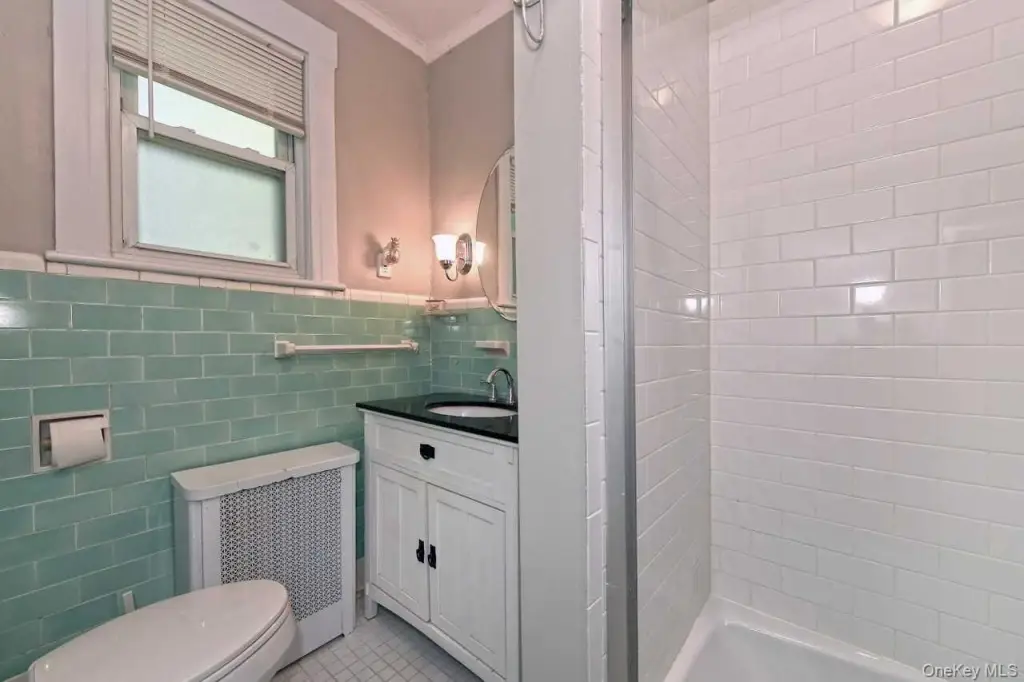
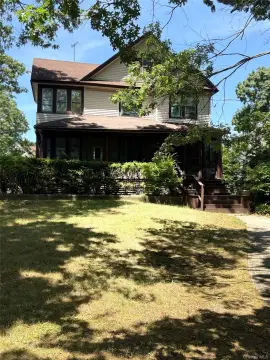
This quadplex comprises two semi-attached Colonial residences constructed in 1920, with four updated one-bedroom, one-bath apartments of approximately 750 square feet each. The property operates as a legal nonconforming use. Upper-level apartments connect directly to shared unfinished attic storage, while the first-floor residences offer basement access for storage and shared laundry. Each ground-floor unit also includes front and rear entrances, a butler pantry, and a wood-burning fireplace.
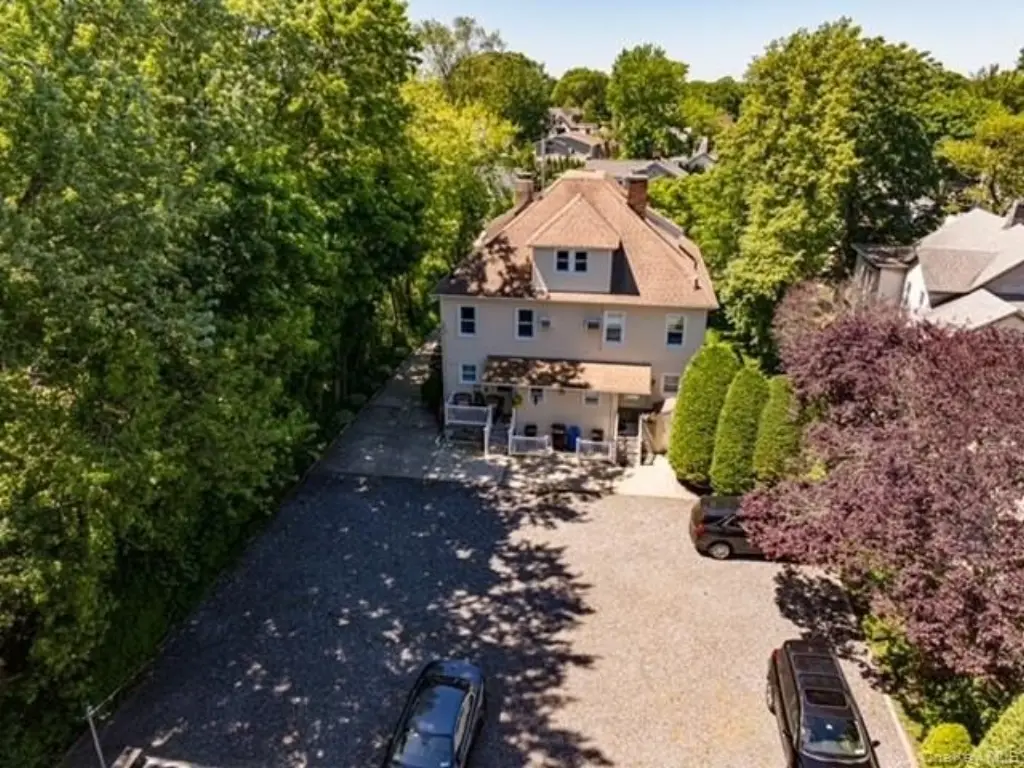
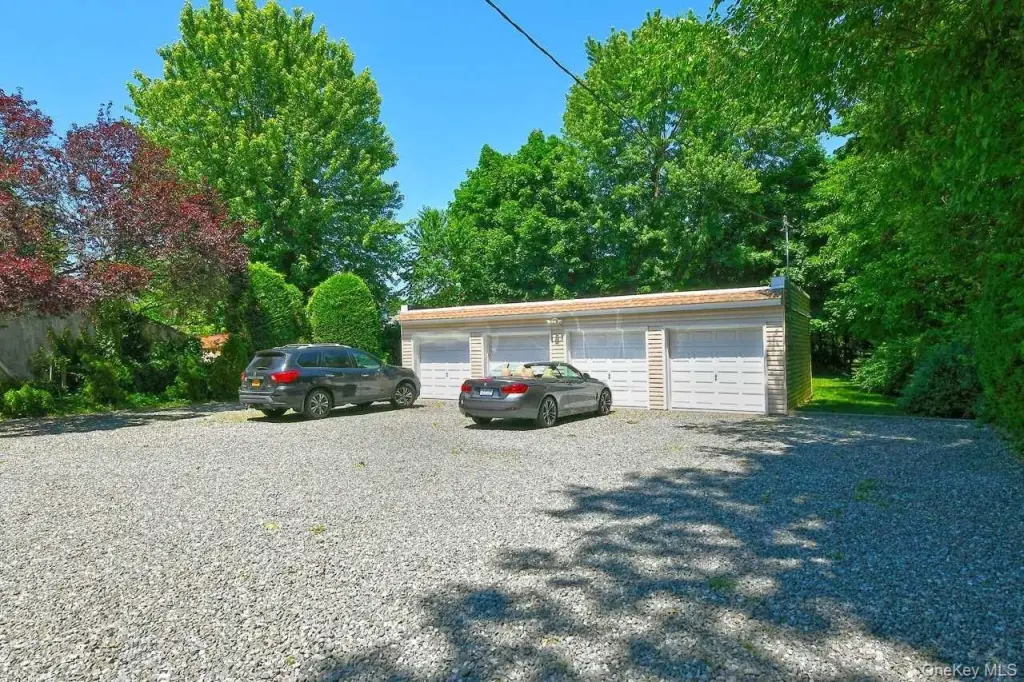
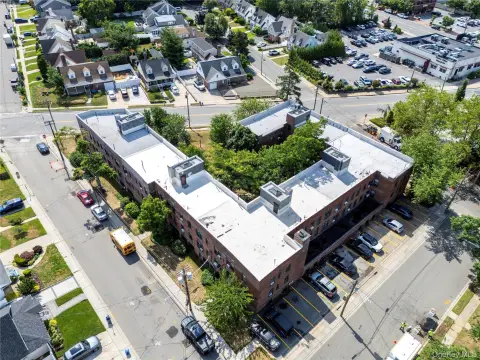
Site improvements include a detached four-car garage and a parking lot with two assigned spaces for each apartment. A shared outdoor area behind the garage provides additional common space. The property is served by public water and public sewer, with natural-gas heating and window or wall/window air-conditioning units. It is located in Rockville Centre near the village center and the Long Island Railroad.
Site improvements include a detached four-car garage and a parking lot with two assigned spaces for each apartment. A shared outdoor area behind the garage provides additional common space. The property is served by public water and public sewer, with natural-gas heating and window or wall/window air-conditioning units. It is located in Rockville Centre near the village center and the Long Island Railroad.
Key Highlights
- Four one‑bedroom, one‑bath apartments, each approximately 750 square feet
- Two semi‑attached Colonial homes built in 1920
- Detached 4 car garage and parking for all 4 units
Property Analytics
Unlock full access to Insights
Subscribe to Realmo Intelligence
Open Analytics
Current Use
Lease Details
4
Residential units
Location Intelligence
Trade Area within ½ mile
2,675
Businesses Nearby
Explore this area
Business Placement
Demographics for 11570, NY
29,023
Population
11,368
Households
2.6
Avg Household Size
42
Median Age
62%
College-Educated
95%
High-School Grad
3.6 sq mi
ZIP Area
8,062
Density / Sq Mi
$147,784
Median Household Income
$91,332
Median Earnings
$1,804
Median Rent
$786,600
Median Home Value
Check the figures for this property
Cap Rate, Value Estimation, Potential NOI and more
View Realmo Analytics
Market
Vacancy Rate% for Multifamily in Northeast region

Questions? Ask Rey
Realmo’s AI knows this listing — price, zoning, demand, history. Ask anything.






Frequently Asked Questions
What type of property is this?
Quadplex - Two semi-attached Colonial homes provide updated apartments, shared laundry, storage, and assigned tenant parking.
Where is this quadplex located?
The property is located at 163/165 Lincoln Avenue Rockville Centre, NY.
What is the asking price?
The asking price for this property is $1,999,999.
What are key features of this property?
This property features: Four one‑bedroom, one‑bath apartments, each approximately 750 square feet; Two semi‑attached Colonial homes built in 1920; Detached 4 car garage and parking for all 4 units