New Construction
For Sale
$619,900
1623-1625 Chamorro St SE, Palm Bay, FL 32909
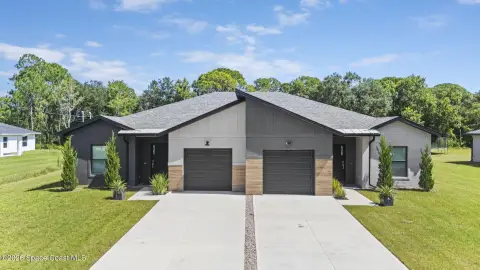
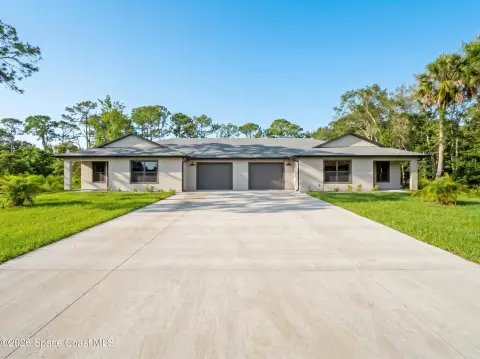
Two private residences combine flexible occupancy with rental income potential and no HOA or CDD fees.
Property Size2,784 SF
Price / SF$222.67
Days on Market63
Property Features for 1623-1625 Chamorro St SE
General Information
Standard status
Active
Size
2,784 SF
Property subtype
Multi-Family
Units
Unit Mix
2 x 3BR/2BA
Multifamily Units
2
Building Details
Year Built
2025
Buildings
1
Listing Agency:
Weichert Realtors Hallmark Pro
Listed By:
Lynnette Hendricks · License #651304
(321) 877-4800
Source:
Floridaeastcoastrealestate
Added: Aug 16
Changed: Oct 16
Last Checked: Oct 16 at 8:26AM
Displayed information is deemed reliable but is not guaranteed and should be independently verified. All listing content including descriptions, pricing, images are the copyrighted material of Weichert Realtors Hallmark Pro

Ask AI about this property
Review the available facts, identify missing information and prepare questions for the agent.
Investment Insights
Based on property information with market context.
Completed in 2025, this duplex contains two separate residences totaling 2,784 square feet. Each side offers three bedrooms and two bathrooms, with clear separation between units and a private back porch facing the spacious backyard.
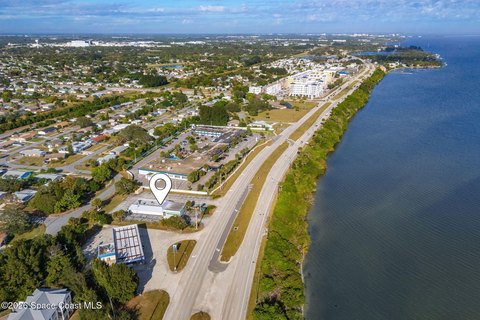
Interior finishes include luxury vinyl plank flooring, large-format tile, quartz and butcher block countertops, wood shaker cabinetry, and black and brass fixtures. Impact windows and doors, LED lighting, and tankless water heaters add practical efficiency features. The property is near Waterstone, the new Publix shopping center, and ongoing surrounding development in Palm Bay. No HOA or CDD fees are reported.
Interior finishes include luxury vinyl plank flooring, large-format tile, quartz and butcher block countertops, wood shaker cabinetry, and black and brass fixtures. Impact windows and doors, LED lighting, and tankless water heaters add practical efficiency features. The property is near Waterstone, the new Publix shopping center, and ongoing surrounding development in Palm Bay. No HOA or CDD fees are reported.
Key Highlights
- Built in 2025 with 2,784 SF across two separate residences
- Each unit has 3 bedrooms and 2 bathrooms
- Luxury vinyl plank, large‑format tile, quartz and butcher block countertops, and wood shaker cabinetry
Financial Insights
Estimated NOI and Cap Rate
NOI / Yr
$32,664
Cap Rate
5.27%
Suggested Prices Based on Cap Rates
Cap Rate 5%
$653,280
$653.3K
Cap Rate 7%
$466,629
$466.6K
Cap Rate 9%
$362,933
$362.9K
Market Conditions
NOI Build-Up for 2,784 SF
Gross rent
$50.4K $18.12/SF
− Vacancy
−$3.8K −$1.36/SF
EGI
$46.7K $16.76/SF
− OpEx
−$14.0K −$5.03/SF
NOI
$32.7K $11.73/SF
Area
Palm Bay, FL
Vacancy
7.50%
Lease Rate
$18.12 /SF/Yr
Expense Ratio
30.00%
Simulate Cap Rate and NOI
Suggested Prices Based on Cap Rates
Cap Rate 5%
$653,280
Cap Rate 7%
$466,629
Cap Rate 9%
$362,933
Alternative Uses
Best Use
Multifamily LT 5
$466.6K
$408.3K – $544.4K
NOI $32,664 @ 7.0% cap · market cap 5.27%
Second Best
Apartment 5plus
$414.5K
$362.7K – $483.6K
NOI $29,017 @ 7.0% cap · market cap 4.68%
Theoretical Best
Office A
$734.5K
$642.7K – $856.9K
NOI $51,415 @ 7.0% cap · market cap 8.29%
Zoning and permitted uses should be independently verified with authorities.
How Realmo checks its estimates
Property Analytics
Unlock full access to Insights
Subscribe to Realmo Intelligence
Open Analytics
Current Use
Lease Details
2
Residential units
Location Intelligence
Trade Area within ½ mile
58
Businesses Nearby
Explore this area
Business Placement
Demographics for 32909, FL
36,789
Population
14,278
Households
2.6
Avg Household Size
42
Median Age
23%
College-Educated
92%
High-School Grad
57.7 sq mi
ZIP Area
638
Density / Sq Mi
$76,708
Median Household Income
$36,071
Median Earnings
$1,502
Median Rent
$261,400
Median Home Value
Check the figures for this property
Cap Rate, Value Estimation, Potential NOI and more
View Realmo Analytics
Market
Vacancy Rate% for Multifamily in South region




Frequently Asked Questions
What type of property is this?
Duplex - Two private residences combine flexible occupancy with rental income potential and no HOA or CDD fees.
Where is this duplex located?
The property is located at 1623-1625 Chamorro St SE Palm Bay, FL.
What is the asking price?
The asking price for this property is $619,900.
What are key features of this property?
This property features: Built in 2025 with 2,784 SF across two separate residences; Each unit has 3 bedrooms and 2 bathrooms; Luxury vinyl plank, large‑format tile, quartz and butcher block countertops, and wood shaker cabinetry