107-Key Furnished
For Sale
Contact for pricing
Pending
1620 Interstate 40 E, Amarillo, TX 79103
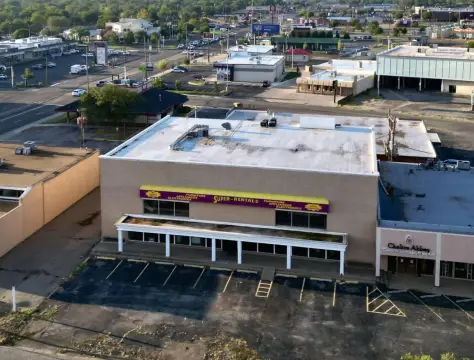
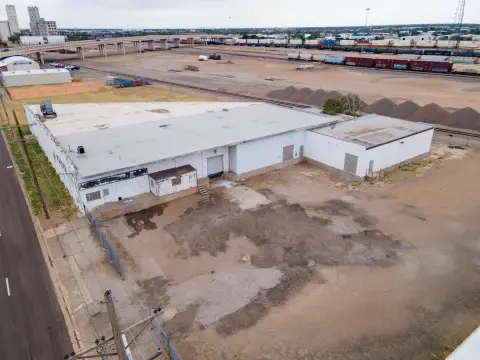
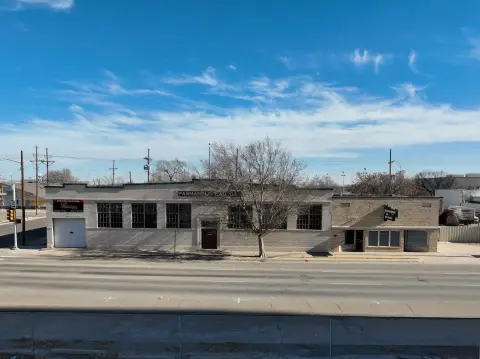
Fully furnished lodging asset with potential for extended-stay or workforce-housing conversion.
Property Size33,968 SF
Days on Market165
Property Features for 1620 Interstate 40 E
General Information
Standard status
Pending
Size
33,968 SF
Class
C
Property subtype
Hospitality
Investment Type
Value Add
Building Details
Year Built
1985
Stories
2
Units
107
Listing Agency:
FIMC Commercial Realty
Listed By:
Kirk Chudej · License #TX 604402
(806) 358-7151
Source:
Crexi
Added: May 6
Changed: Oct 11
Last Checked: Oct 16 at 7:06AM
Displayed information is deemed reliable but is not guaranteed and should be independently verified. All listing content including descriptions, pricing, images are the copyrighted material of FIMC Commercial Realty

Ask AI about this property
Review the available facts, identify missing information and prepare questions for the agent.
Investment Insights
Based on property information with market context.
The property is a 107-key hotel at 1620 Interstate 40 E in Amarillo, Texas. Built in 1985, the asset is being offered with existing furnishings, allowing continued hotel use or consideration of alternative operating formats described for the property.
Potential repositioning concepts include extended-stay lodging, workforce housing, or continued operation as a traditional hotel. The address places the asset along Interstate 40 E, while the existing hotel configuration and furnishings provide a foundation for evaluating those alternatives.
Potential repositioning concepts include extended-stay lodging, workforce housing, or continued operation as a traditional hotel. The address places the asset along Interstate 40 E, while the existing hotel configuration and furnishings provide a foundation for evaluating those alternatives.
Key Highlights
- 107‑key hotel property
- Fully furnished asset
- Built in 1985
Financial Insights
Estimated NOI and Cap Rate
NOI / Yr
$159,735
Cap Rate
5.37%
Suggested Prices Based on Cap Rates
Cap Rate 5%
$3,194,700
$3.2M
Cap Rate 7%
$2,281,929
$2.3M
Cap Rate 9%
$1,774,833
$1.8M
Market Conditions
NOI Build-Up for 33,968 SF
Gross rent
$448.4K $13.20/SF
− Vacancy
−$112.1K −$3.30/SF
EGI
$336.3K $9.90/SF
− OpEx
−$176.5K −$5.20/SF
NOI
$159.7K $4.70/SF
Area
Amarillo, TX
Vacancy
25.00%
Lease Rate
$13.20 /SF/Yr
Expense Ratio
52.50%
Simulate Cap Rate and NOI
Suggested Prices Based on Cap Rates
Cap Rate 5%
$3,194,700
Cap Rate 7%
$2,281,929
Cap Rate 9%
$1,774,833
Alternative Uses
Best Use
Hotel Hospitality
$2.28M
$2.00M – $2.66M
NOI $159,735 @ 7.0% cap · market cap 5.37%
Second Best
—
—
no second resolved use
Theoretical Best
Office A
$7.58M
$6.64M – $8.85M
NOI $530,879 @ 7.0% cap · market cap 17.84%
Zoning and permitted uses should be independently verified with authorities.
How Realmo checks its estimates
Property Analytics
Unlock full access to Insights
Subscribe to Realmo Intelligence
Open Analytics
Current Use
Location Intelligence
Trade Area within ½ mile
380
Businesses Nearby
Explore this area
Business Placement
Demographics for 79103, TX
10,532
Population
3,784
Households
2.8
Avg Household Size
34
Median Age
13%
College-Educated
80%
High-School Grad
4.3 sq mi
ZIP Area
2,449
Density / Sq Mi
$55,885
Median Household Income
$35,862
Median Earnings
$1,197
Median Rent
$123,900
Median Home Value
Check the figures for this property
Cap Rate, Value Estimation, Potential NOI and more
View Realmo Analytics





Frequently Asked Questions
What type of property is this?
Hotel - Fully furnished lodging asset with potential for extended-stay or workforce-housing conversion.
Where is this hotel located?
The property is located at 1620 Interstate 40 E Amarillo, TX.
What is the asking price?
The asking price for this property is $2,975,000.
What are key features of this property?
This property features: 107‑key hotel property; Fully furnished asset; Built in 1985


