Duplex With Renovation
For Sale
$699,900
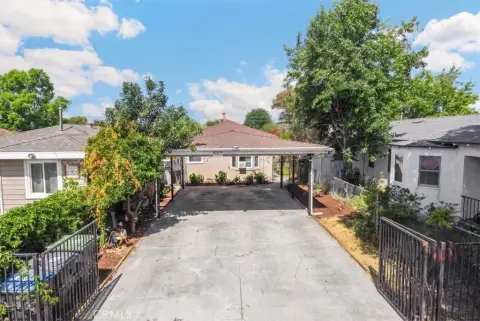
1618 W 3rd, Santa Ana, CA 92703
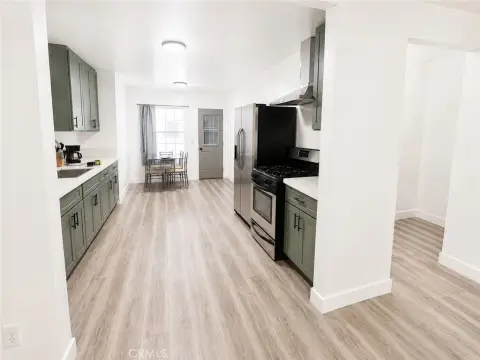
Built in 1922 and offered as-is, the property is positioned for cosmetic and functional upgrades.
Property Size1,869 SF
Days on Market55
Property Features for 1618 W 3rd
General Information
Standard status
Active
Size
1,869 SF
Property subtype
Duplex
Property Condition
Severity
Repairs Needed
Evidence
fixer-upper
Additional Details
Highway Access
Yes
Building Details
Building Size
1,869 SF
Year Built
1922
Listing Agency:
Seven Gables Real Estate
Listed By:
Eduardo Vargas · License #01219811
(714) 731-3777
Source:
Stephanieyounggroup
Added: Aug 21
Changed: Oct 5
Last Checked: Oct 13 at 3:48AM
Displayed information is deemed reliable but is not guaranteed and should be independently verified. All listing content including descriptions, pricing, images are the copyrighted material of Seven Gables Real Estate
Investment Insights
Based on property information with market context.
This duplex property at 1618 W 3rd in Santa Ana was built in 1922 and is being offered in its current as-is condition. The asset requires renovation, with both cosmetic and functional improvements identified as part of its repositioning potential.
The property is centrally situated with access to Interstate 5 and State Route 22. Downtown Santa Ana, shopping, dining, schools, and employment centers are also identified in the surrounding area, providing access to a range of everyday services and community destinations.
The property is centrally situated with access to Interstate 5 and State Route 22. Downtown Santa Ana, shopping, dining, schools, and employment centers are also identified in the surrounding area, providing access to a range of everyday services and community destinations.
Key Highlights
- Duplex property at 1618 W 3rd, Santa Ana, CA 92703
- Constructed in 1922
- Sold in as‑is condition
Financial Insights
Estimated NOI and Cap Rate
NOI / Yr
$33,840
Cap Rate
4.83%
Suggested Prices Based on Cap Rates
Cap Rate 5%
$676,800
$676.8K
Cap Rate 7%
$483,429
$483.4K
Cap Rate 9%
$376,000
$376.0K
Market Conditions
NOI Build-Up for 1,869 SF
Gross rent
$50.5K $27.00/SF
− Vacancy
−$2.1K −$1.13/SF
EGI
$48.3K $25.87/SF
− OpEx
−$14.5K −$7.76/SF
NOI
$33.8K $18.11/SF
Area
ZIP 92703
Vacancy
4.20%
Lease Rate
$27.00 /SF/Yr
Expense Ratio
30.00%
Simulate Cap Rate and NOI
Suggested Prices Based on Cap Rates
Cap Rate 5%
$676,800
Cap Rate 7%
$483,429
Cap Rate 9%
$376,000
Alternative Uses
Best Use
Multifamily LT 5
$483.4K
$423.0K – $564.0K
NOI $33,840 @ 7.0% cap · market cap 4.83%
Second Best
Apartment 5plus
$447.8K
$391.9K – $522.5K
NOI $31,349 @ 7.0% cap · market cap 4.48%
Theoretical Best
Office A
$540.9K
$473.3K – $631.1K
NOI $37,866 @ 7.0% cap · market cap 5.41%
Zoning and permitted uses should be independently verified with authorities.
How Realmo checks its estimates
Property Analytics
Unlock full access to Insights
Subscribe to Realmo Intelligence
Open Analytics
Current Use
Lease Details
Yes
Highway access
Location Intelligence
Trade Area within ½ mile
1,067
Businesses Nearby
Explore this area
Business Placement
Demographics for 92703, CA
65,621
Population
14,644
Households
4.5
Avg Household Size
34
Median Age
13%
College-Educated
60%
High-School Grad
4.2 sq mi
ZIP Area
15,624
Density / Sq Mi
$80,817
Median Household Income
$33,363
Median Earnings
$1,922
Median Rent
$585,900
Median Home Value
Check the figures for this property
Cap Rate, Value Estimation, Potential NOI and more
View Realmo Analytics
Market
Vacancy Rate% for Multifamily in West region

Questions? Ask Rey
Realmo’s AI knows this listing — price, zoning, demand, history. Ask anything.






Frequently Asked Questions
What type of property is this?
Duplex - Built in 1922 and offered as-is, the property is positioned for cosmetic and functional upgrades.
Where is this duplex located?
The property is located at 1618 W 3rd Santa Ana, CA.
What is the asking price?
The asking price for this property is $699,900.
What are key features of this property?
This property features: Duplex property at 1618 W 3rd, Santa Ana, CA 92703; Constructed in 1922; Sold in as‑is condition


