Duplex with Renovated Lower
For Sale
$259,900
16 Walter Street, Bangor, ME 04401
Multi-Family, Bangor, ME
Property Size2,008 SF
Lot Size0.09 Acres
Price / SF$129.43
Days on Market150
Property Features for 16 Walter Street
General Information
Property type
Residential Multi Family
Property subtype
Other
Zoning
Residential
Bathrooms
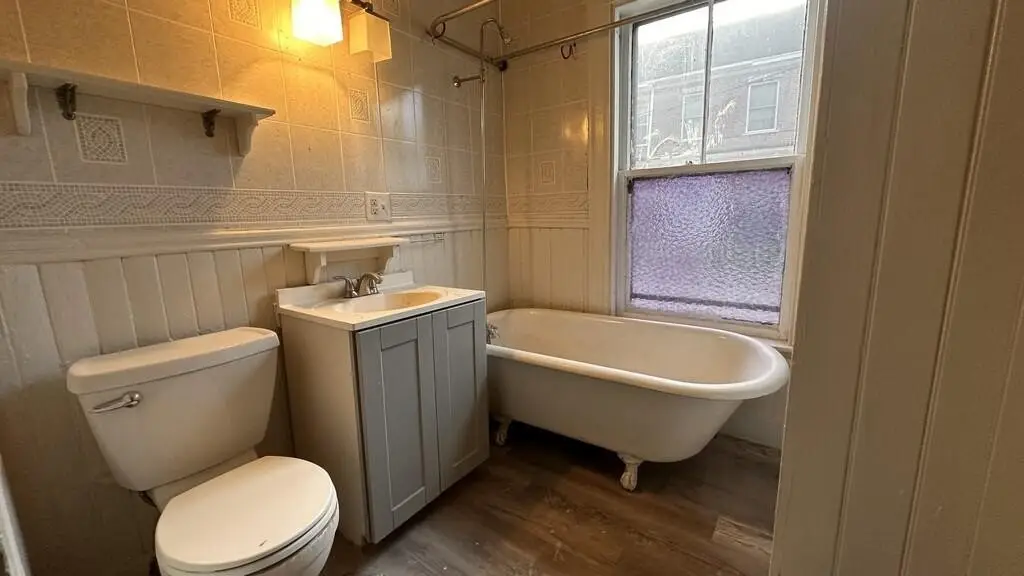
2
Full bathrooms
2
Rooms
Basement, Bathroom 1, Bathroom 2
Patio and Porch features
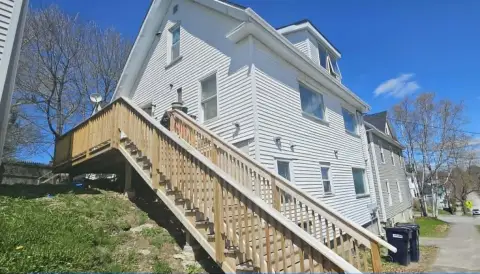
Deck
Pets allowed
No
Basement
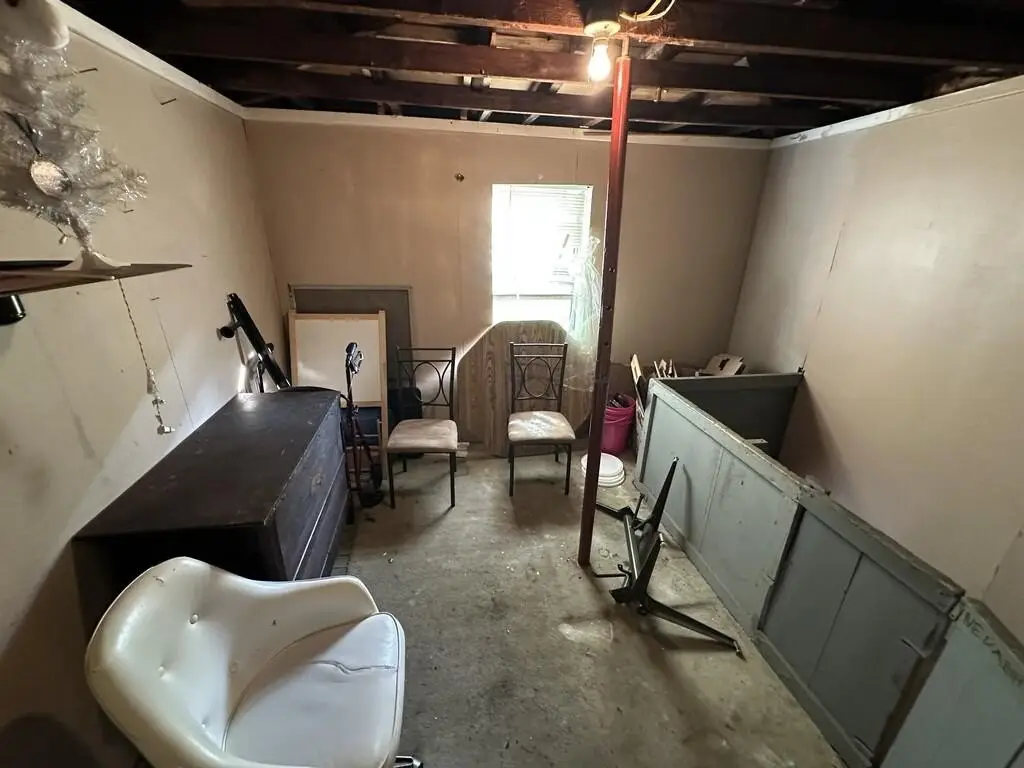
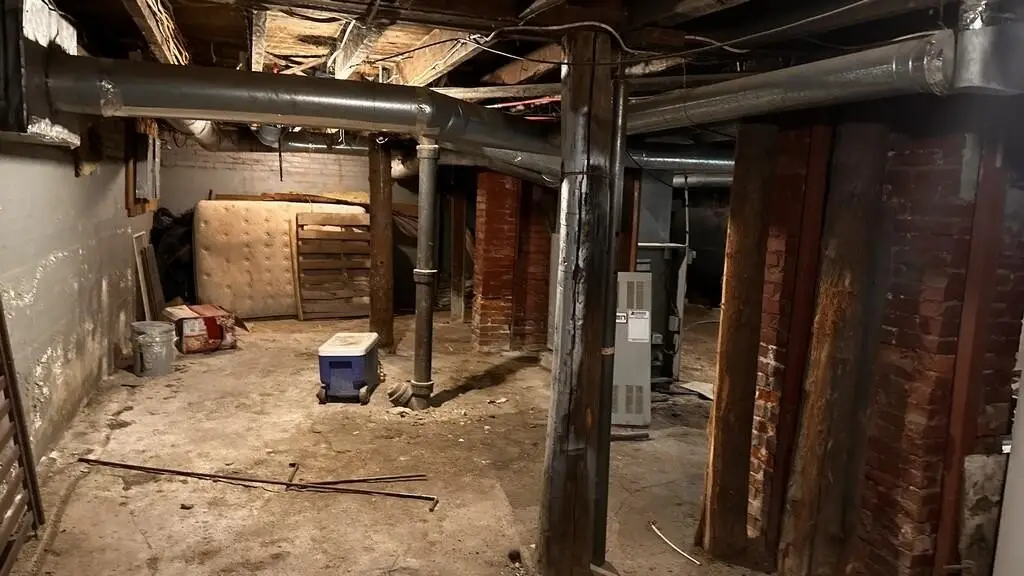
Dirt Floor, Sump Pump, Unfinished, Full
Lot features
Level, Sidewalks, Intown, Near Golf Course, Near Shopping, Near Turnpike/ Interstate, Neighborhood, Near Public Transit
Standard status
Active
Size
2,008 SF
Lot size
0.09 Acres
Taxes and HOA fees
Tax Year
2024
Tax Annual Amount
3024
Utilities
Sewer type
Public Sewer
Heating system
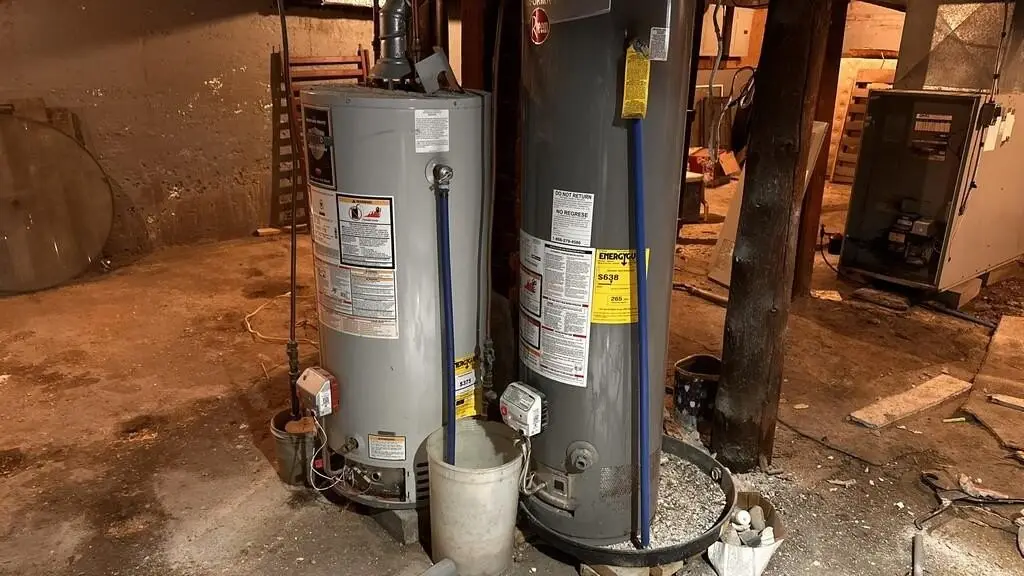
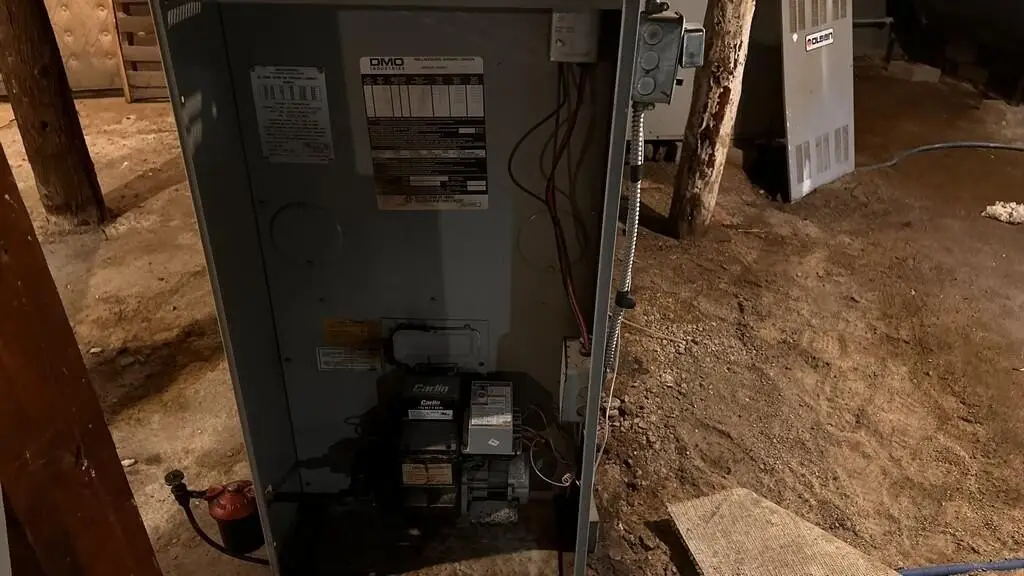
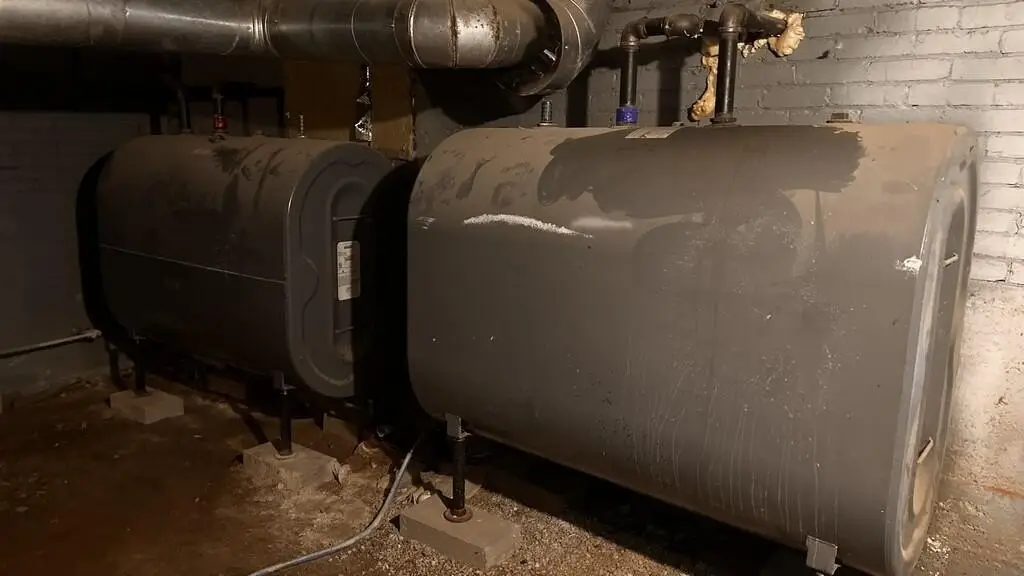
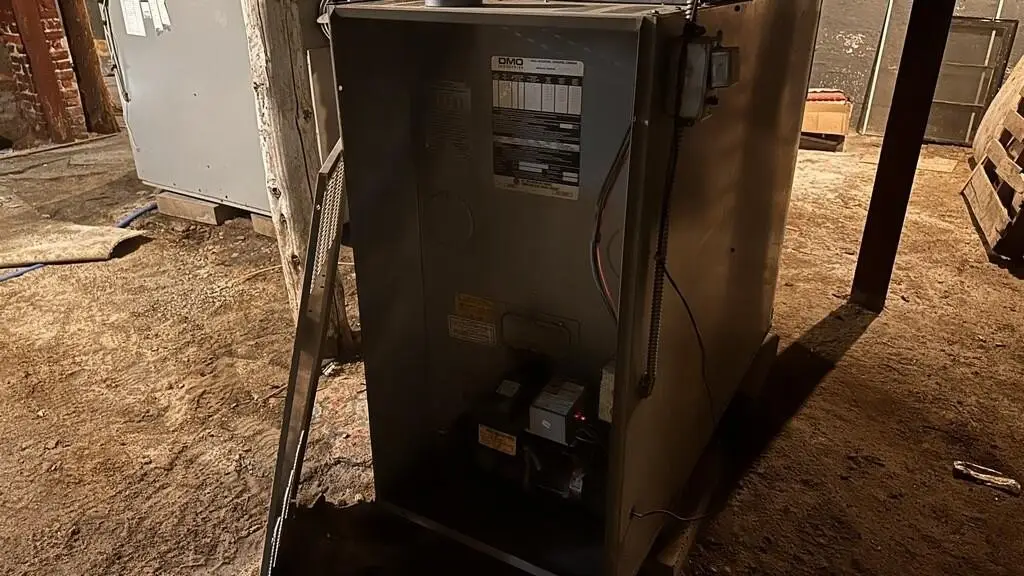
Forced Air, Oil
Water source
Public
Building Details
Year built
1900
Floors in Building
2
Number of units
2
Flooring type
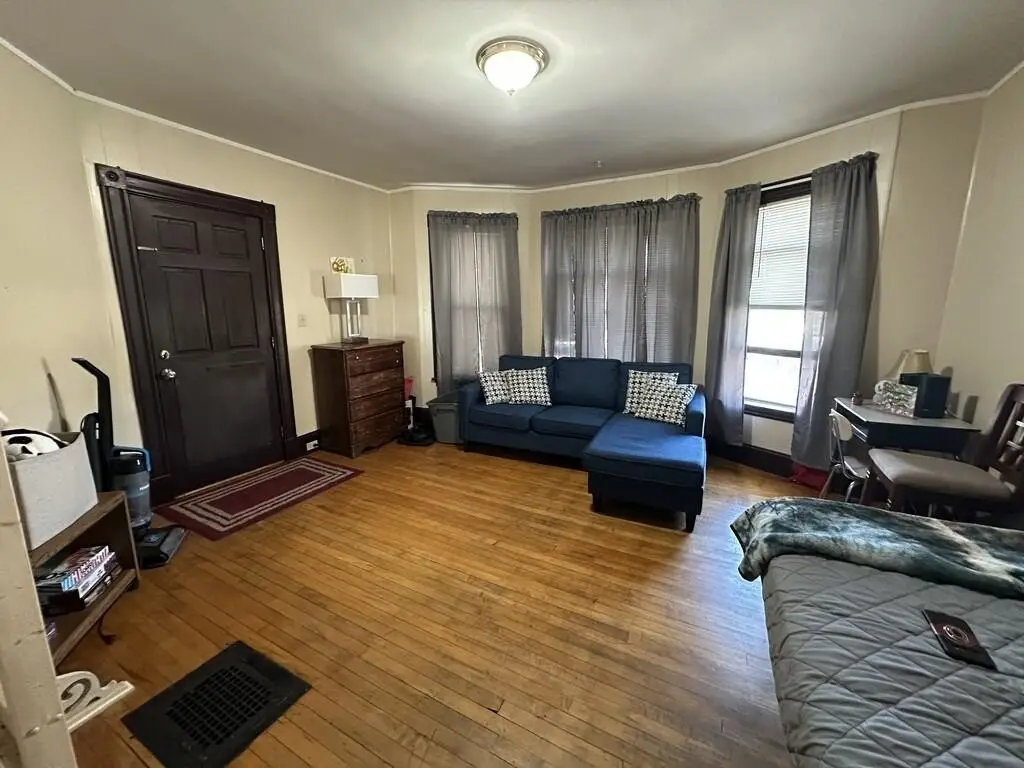
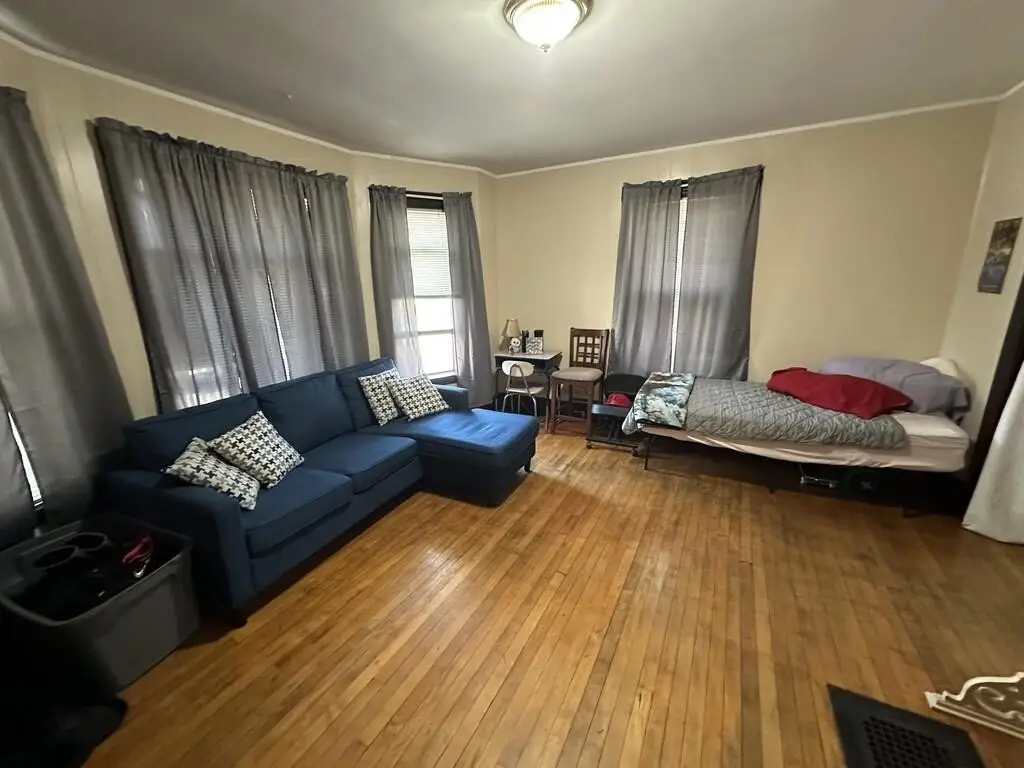
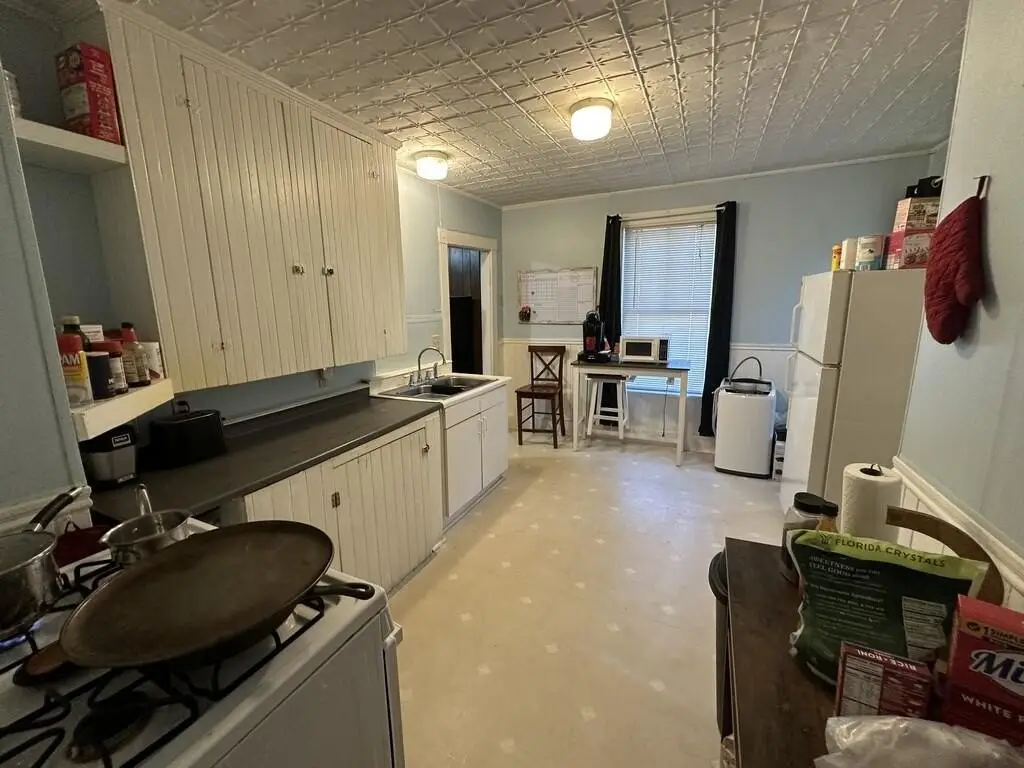
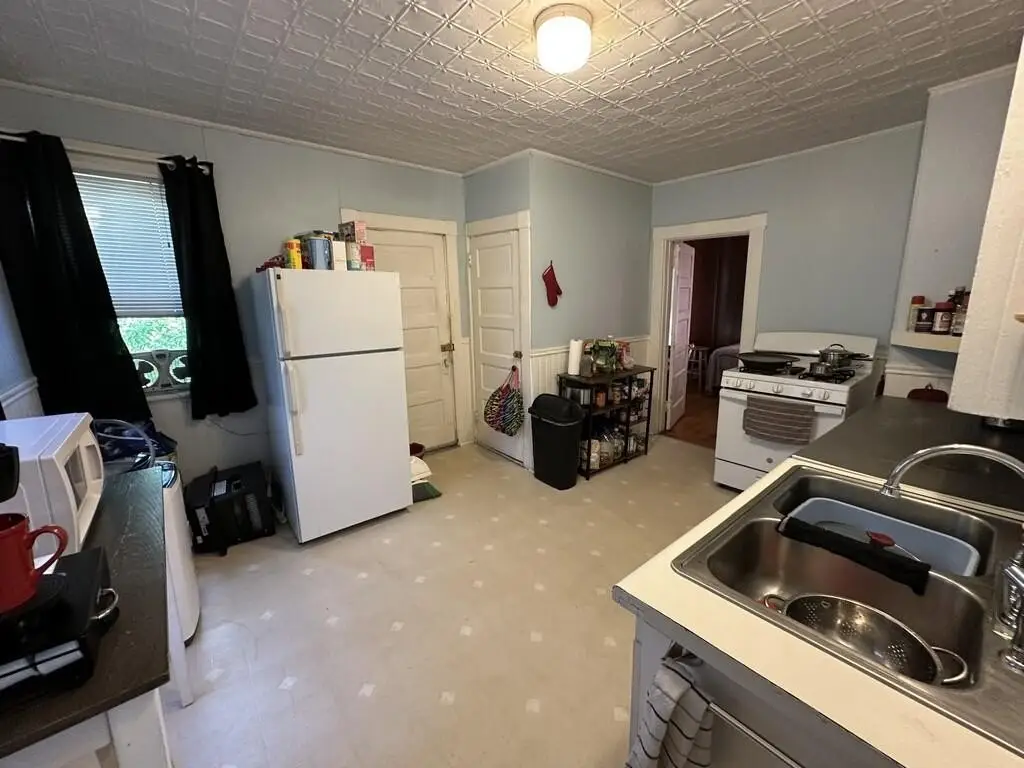
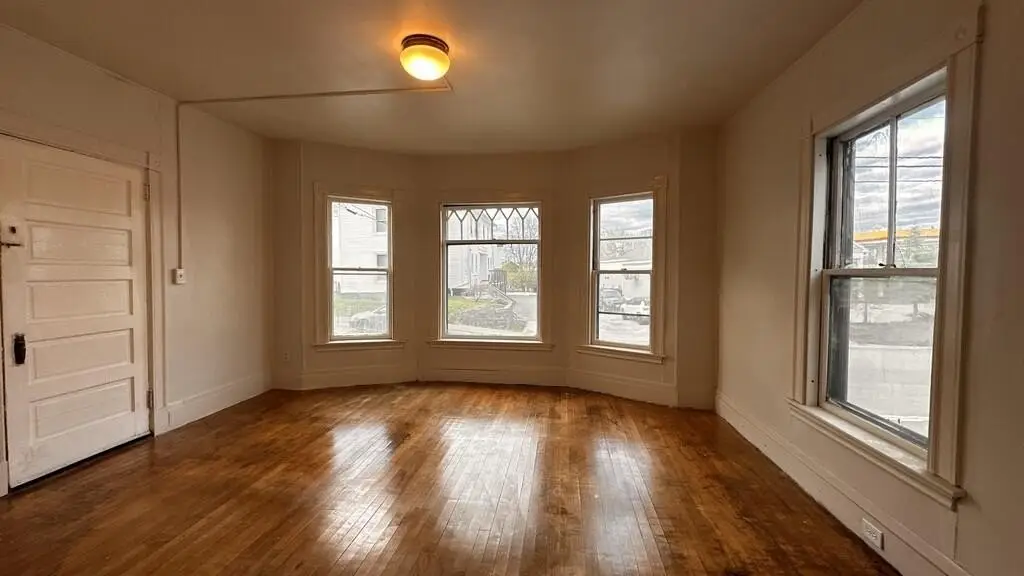
Wood, Linoleum, Hardwood
Building materials
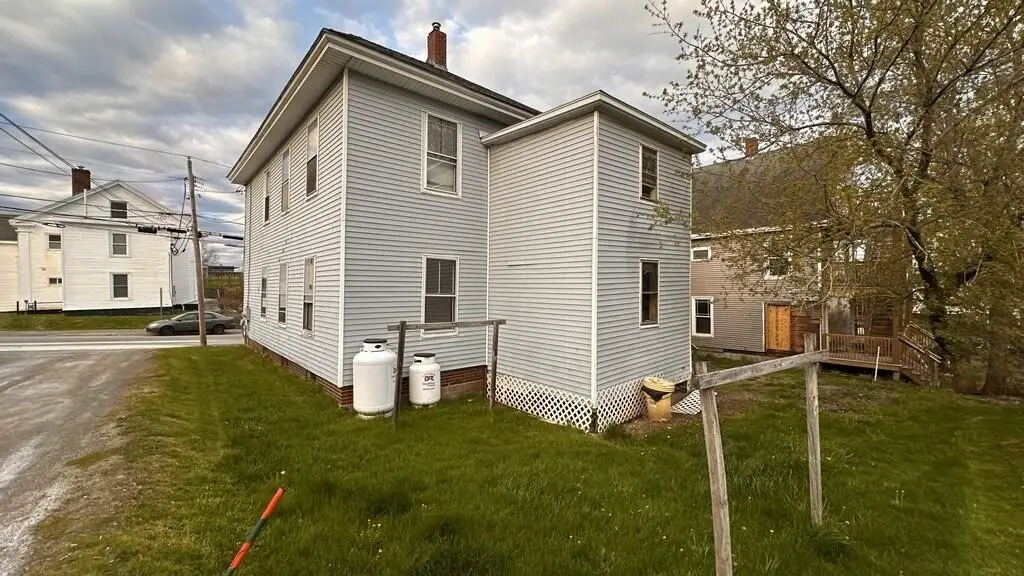
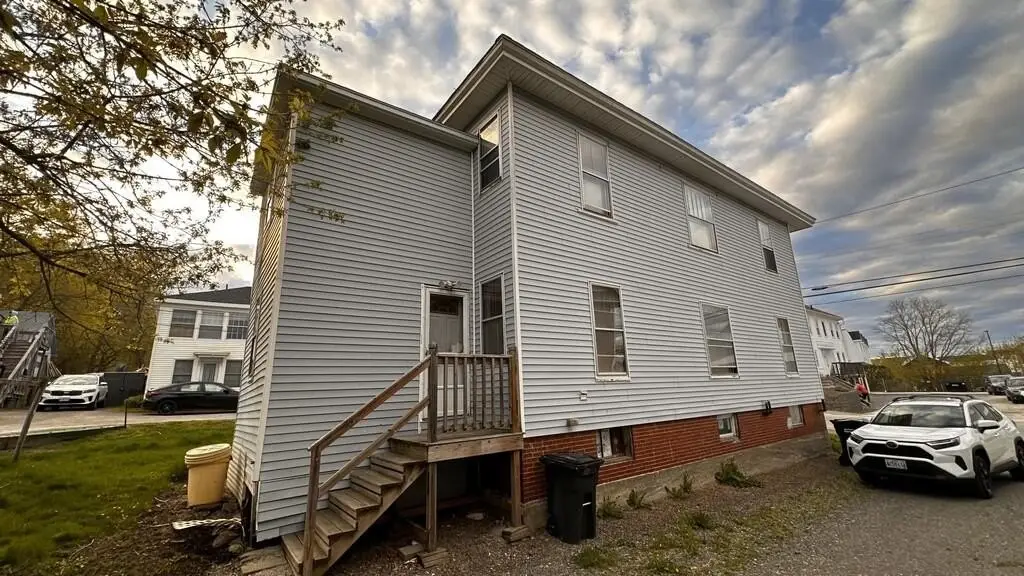
Wood Frame, Vinyl Siding
Roof type
Shingle
Architectural style
Colonial
Listing Agency:
ERA Dawson-Bradford Co. · ERA Real Estate
(207) 947-6788
Listed By:
Richard Kenefic
(207) 299-7695
Added: May 19
Changed: Oct 8
Last Checked: Oct 15 at 7:06AM
MLS# 1662774
Copyright © 2026 Maine Listings. All rights reserved. All information provided by the listing agent/broker is deemed reliable but is not guaranteed and should be independently verified.
Investment Insights
Based on property information with market context.
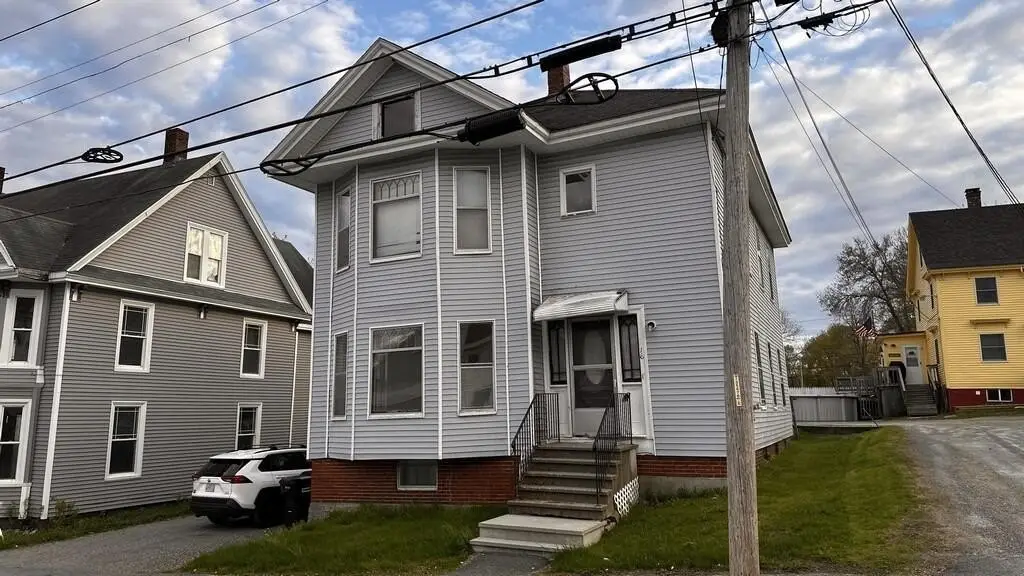
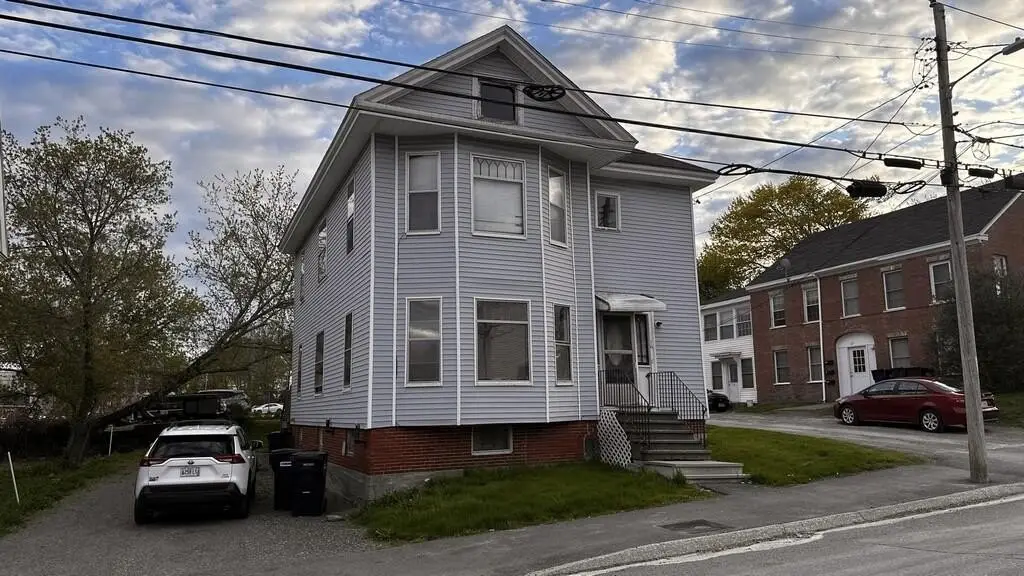
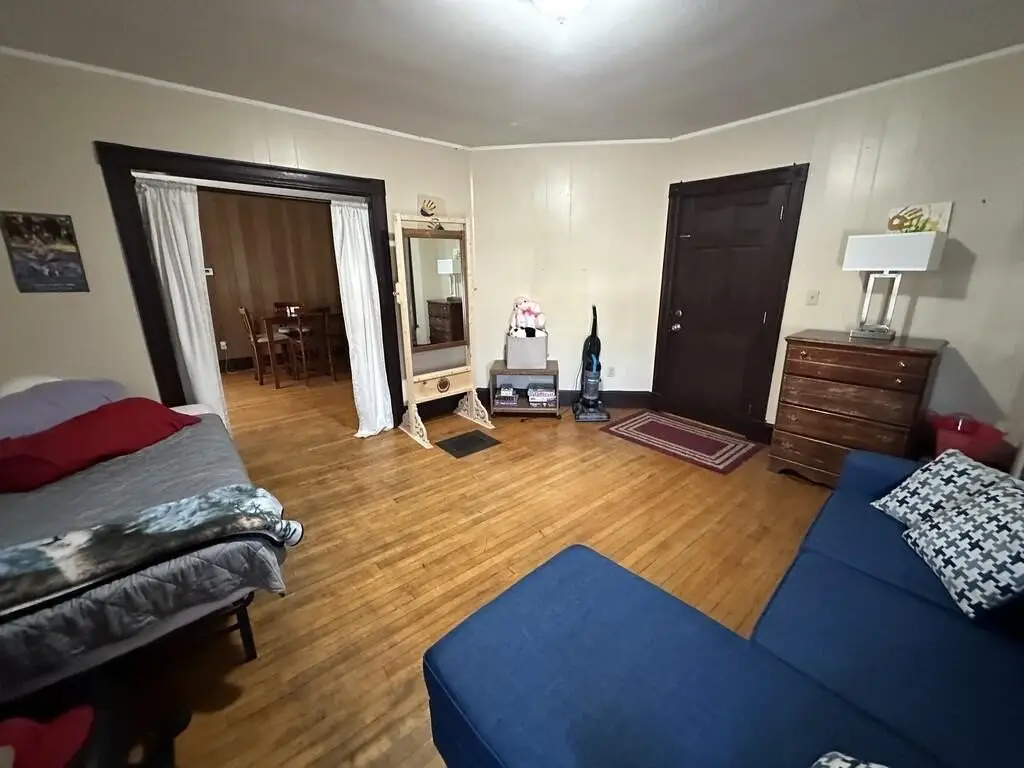
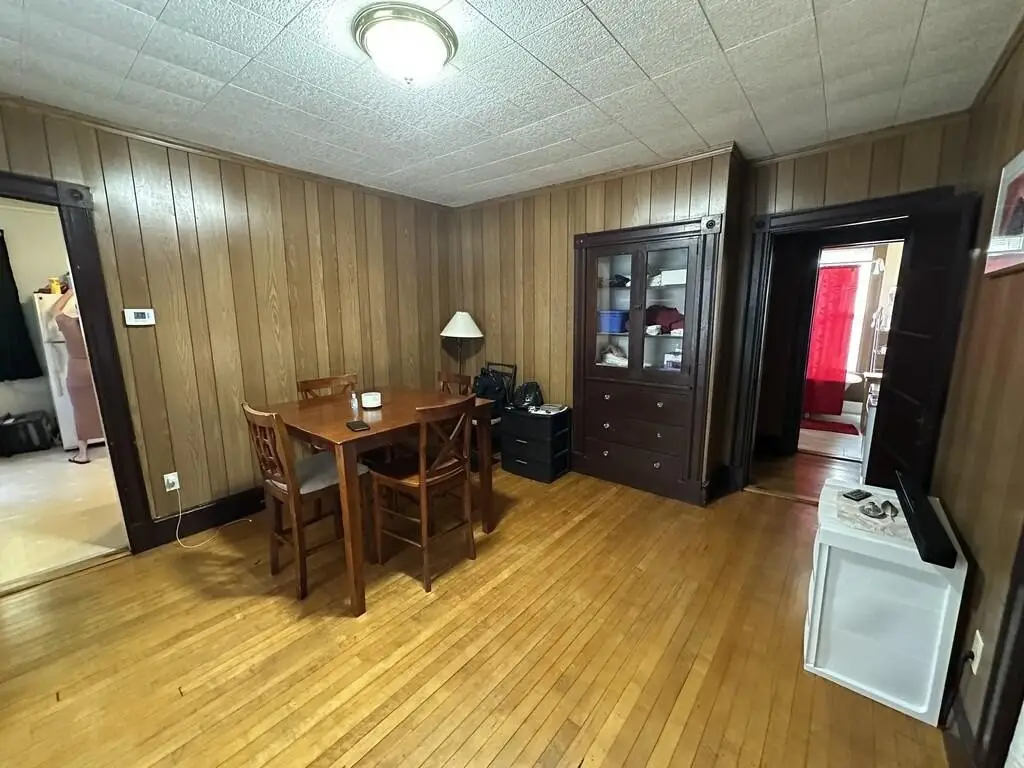
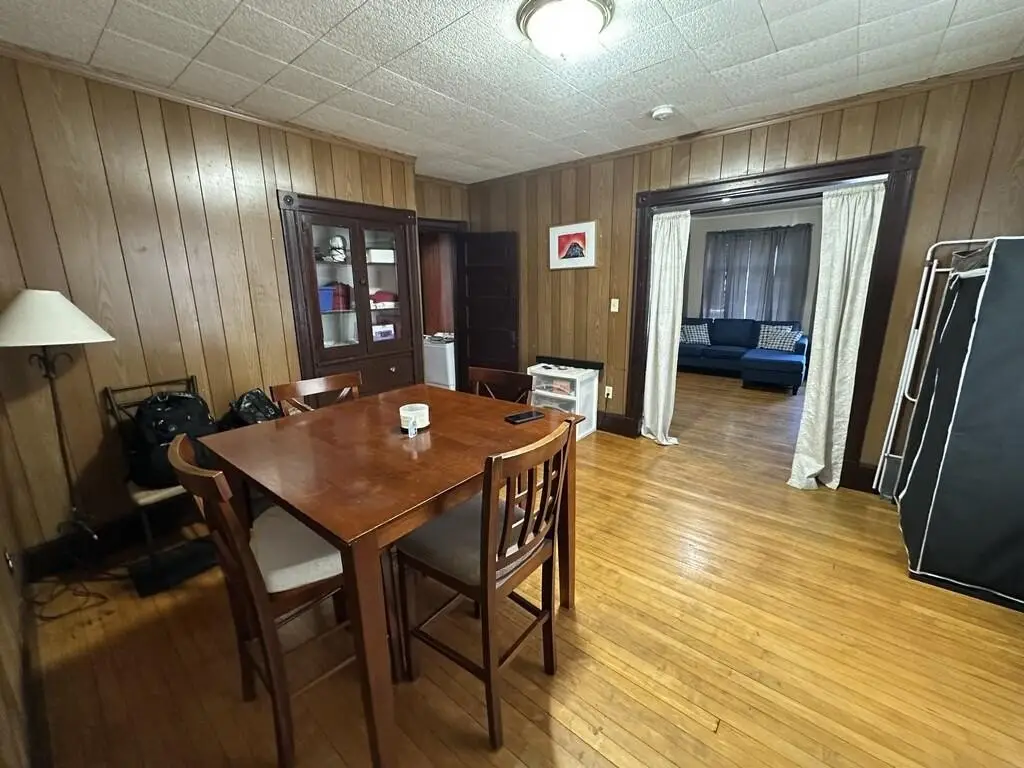
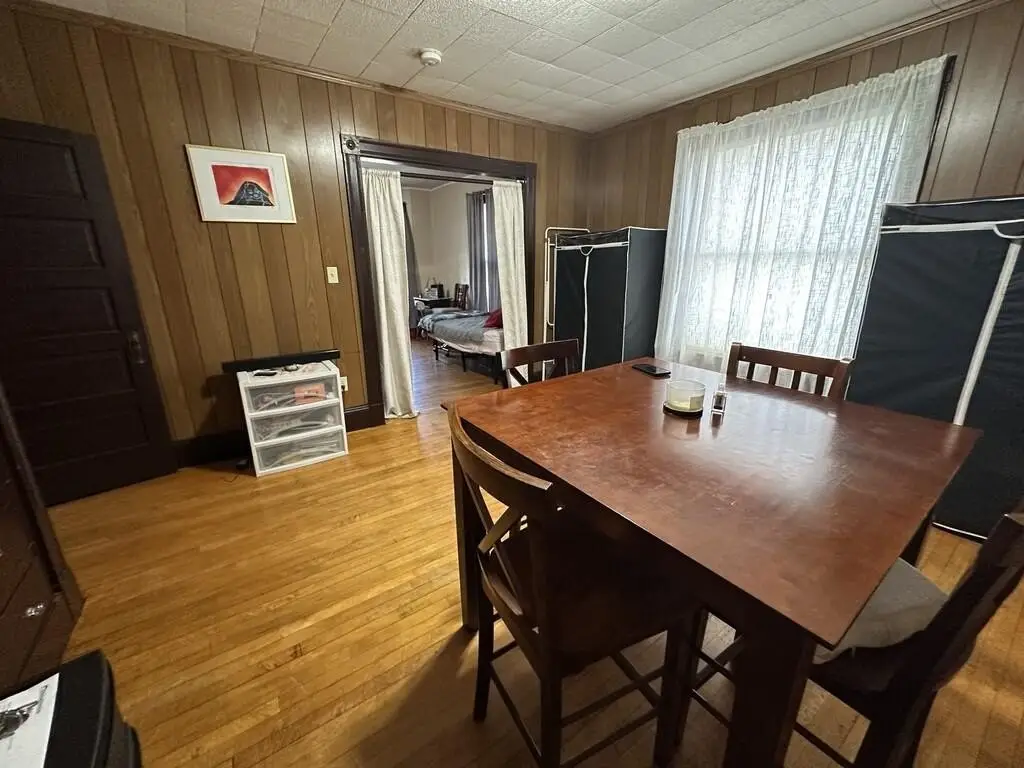
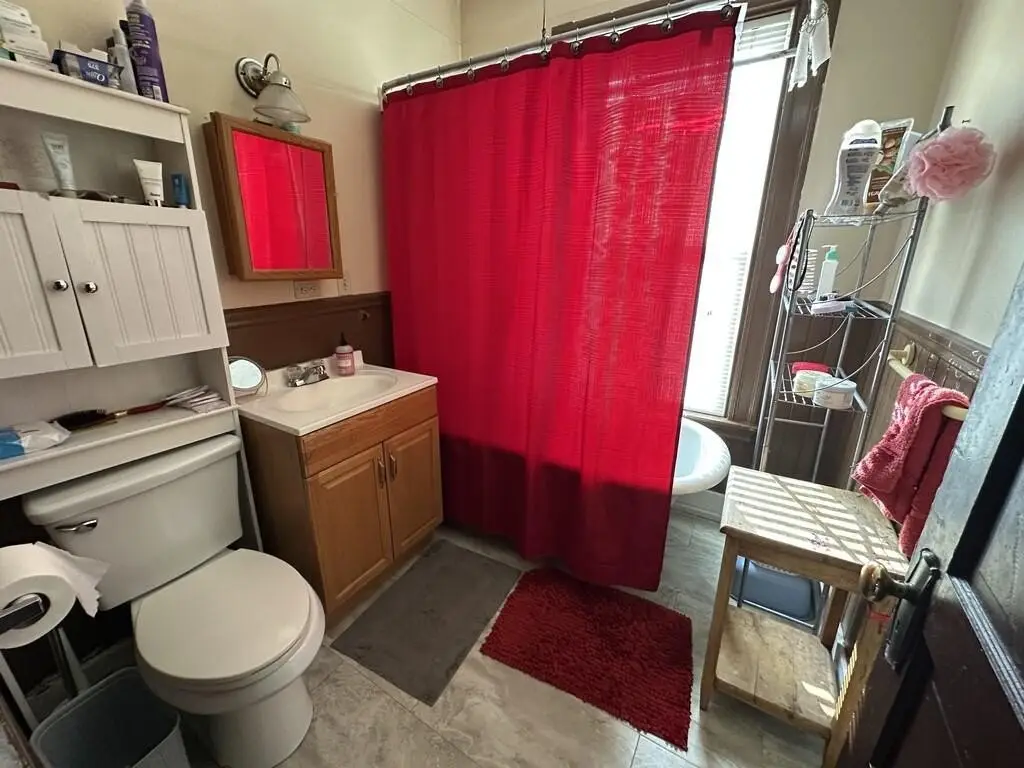
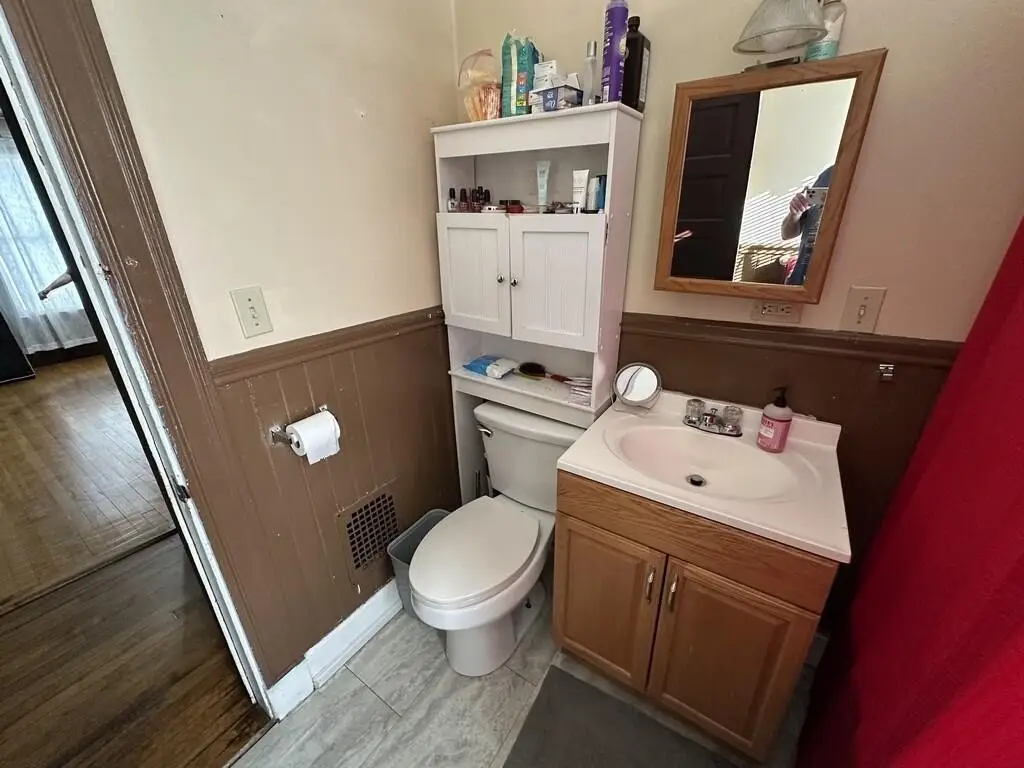
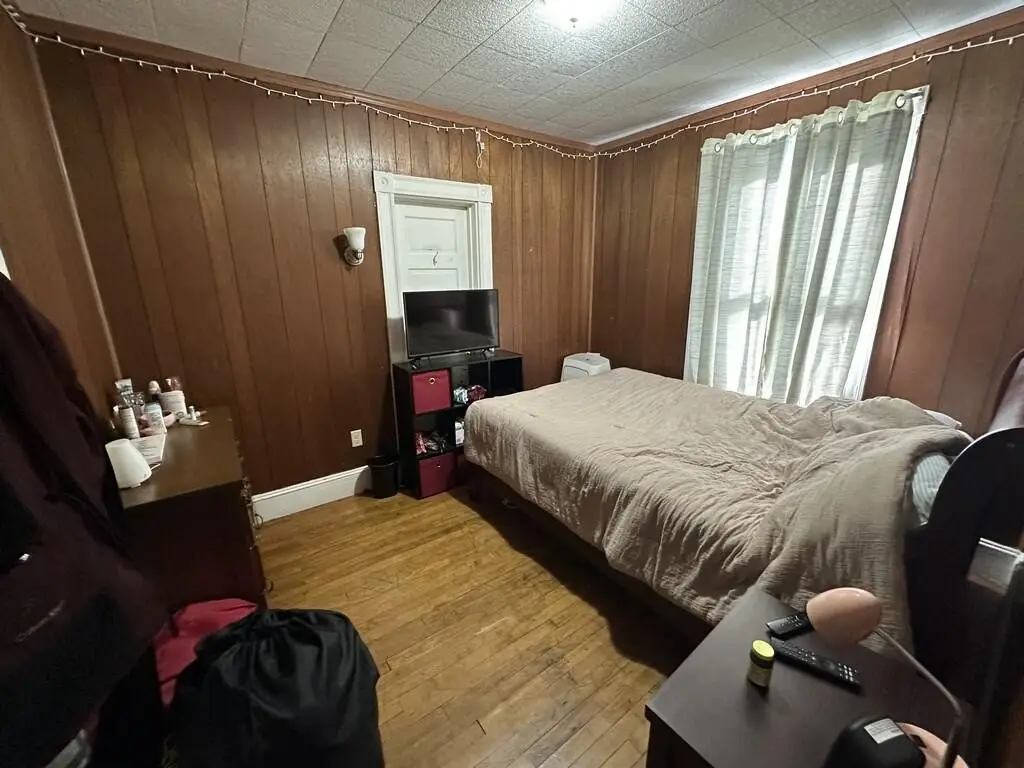
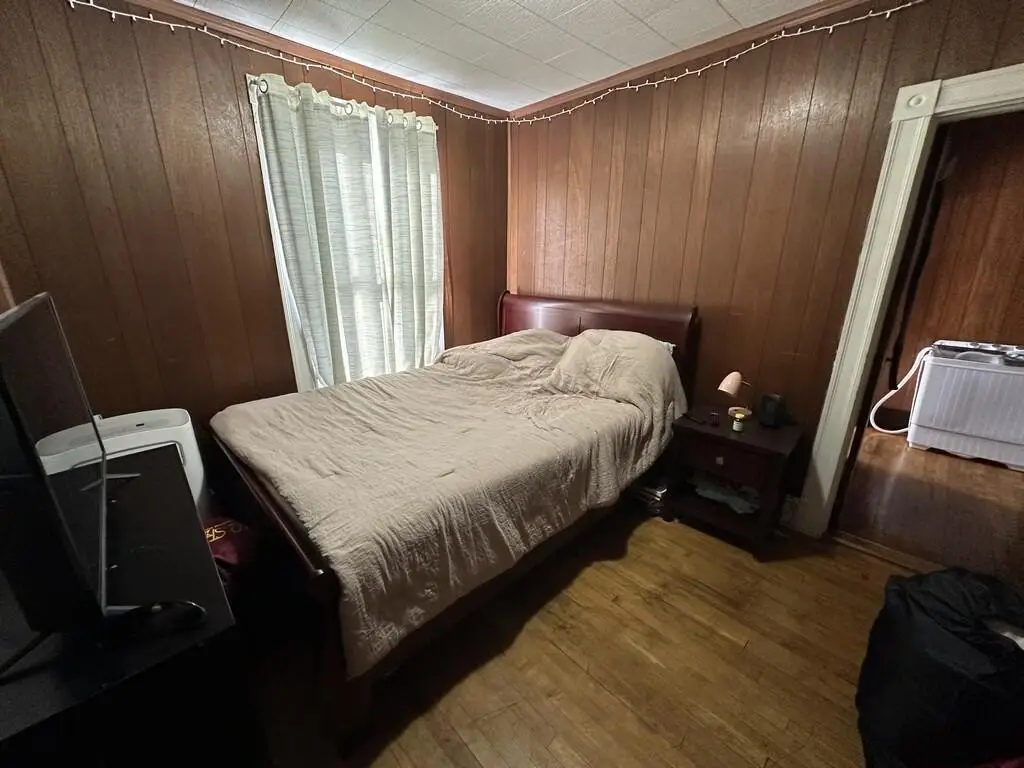
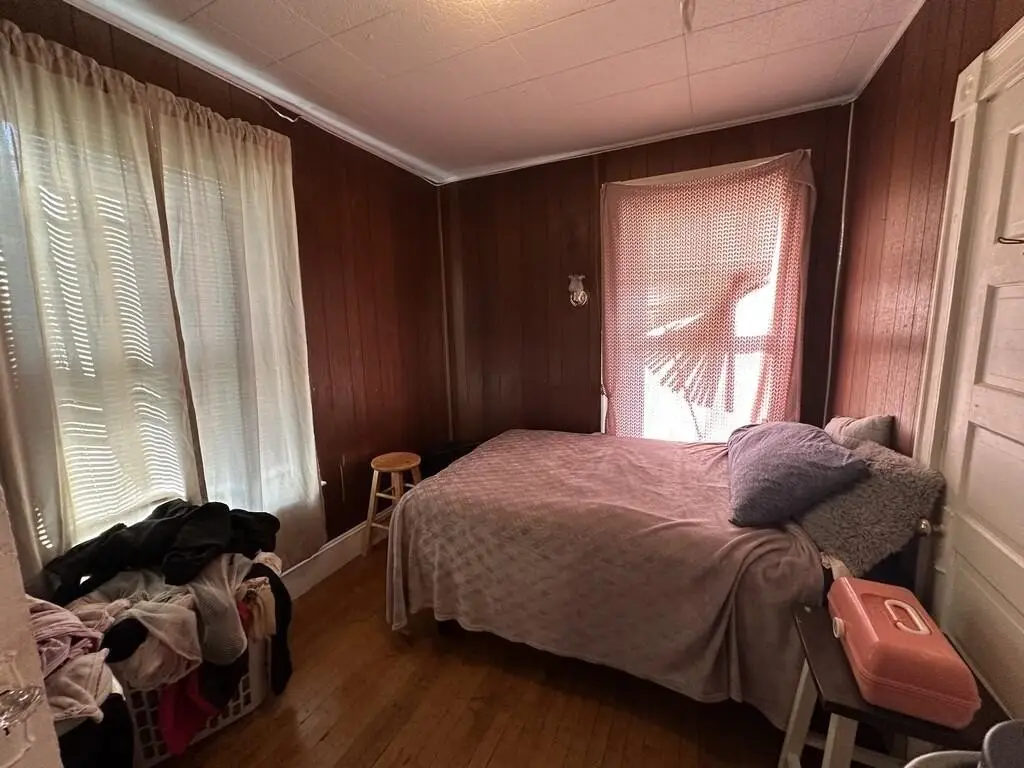
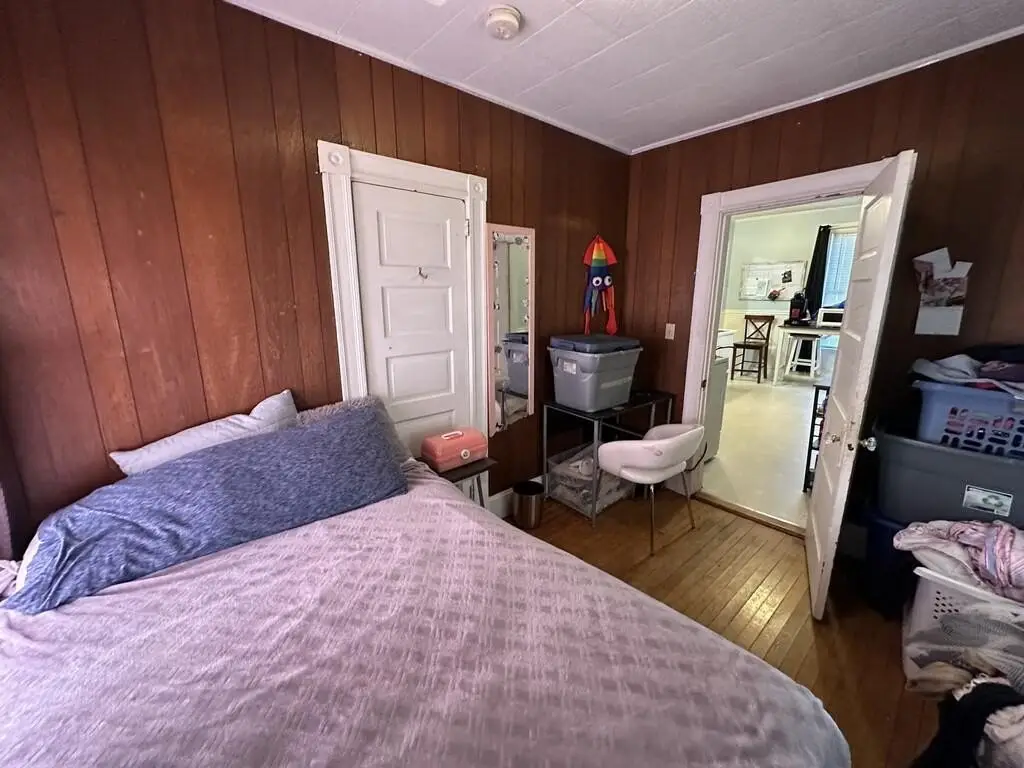
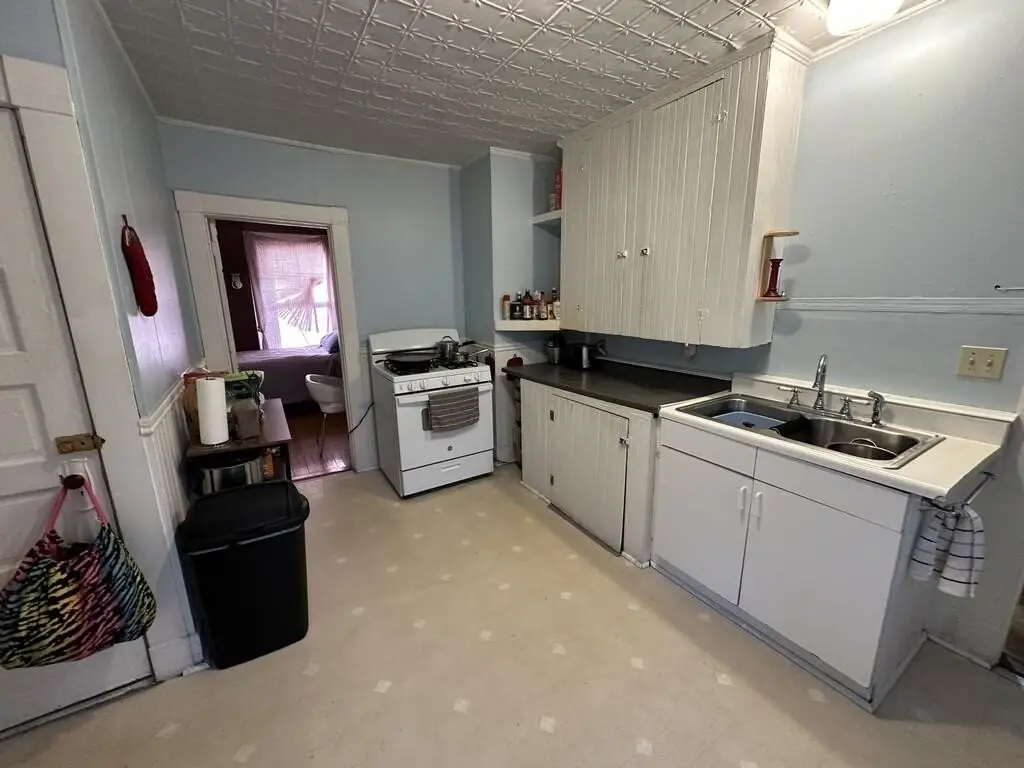
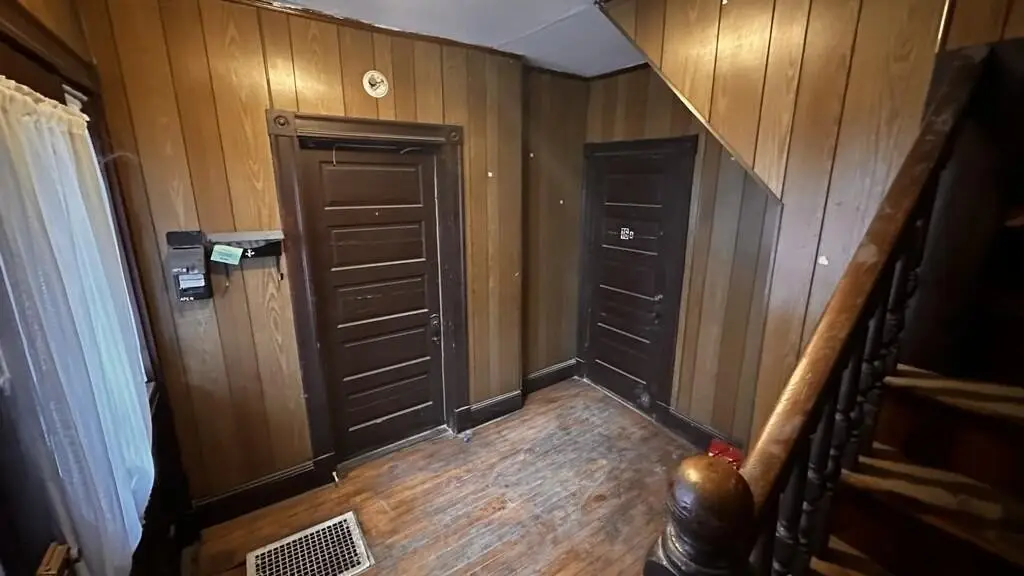
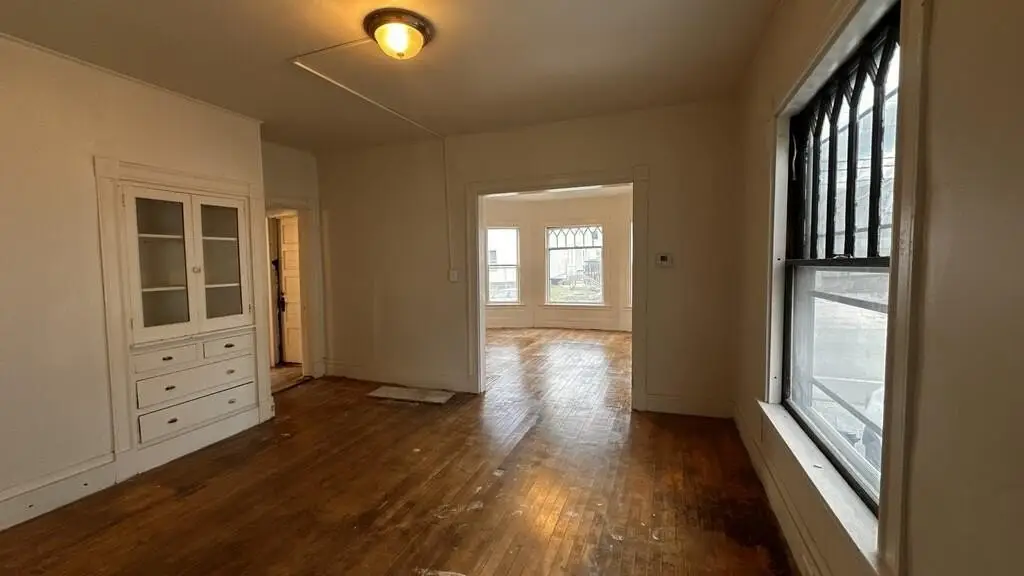
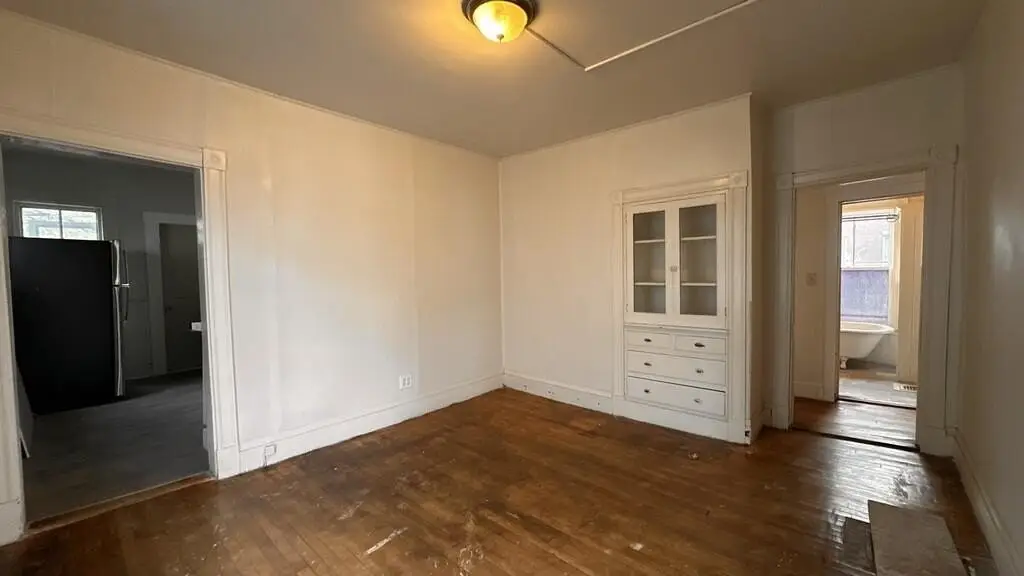
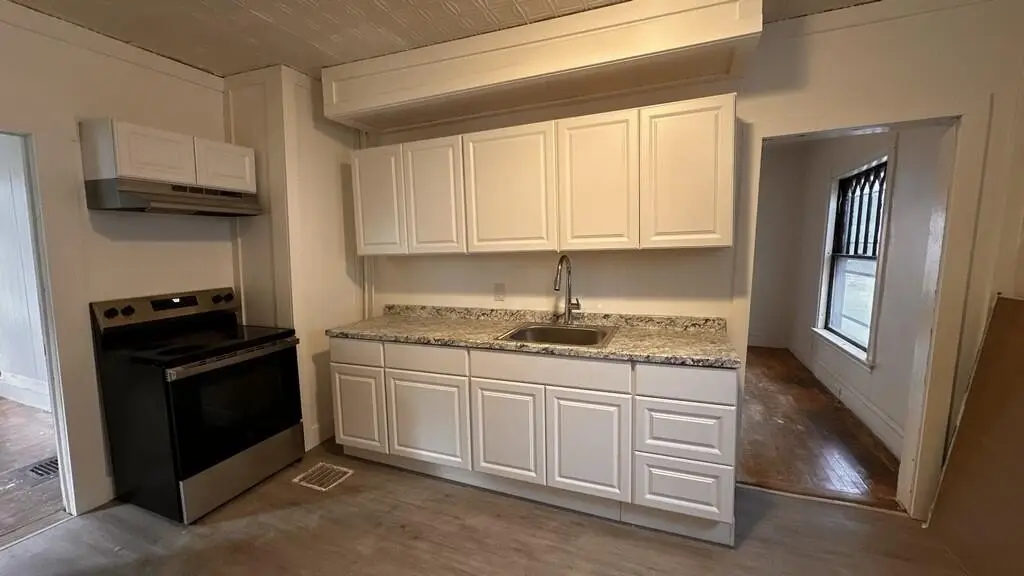
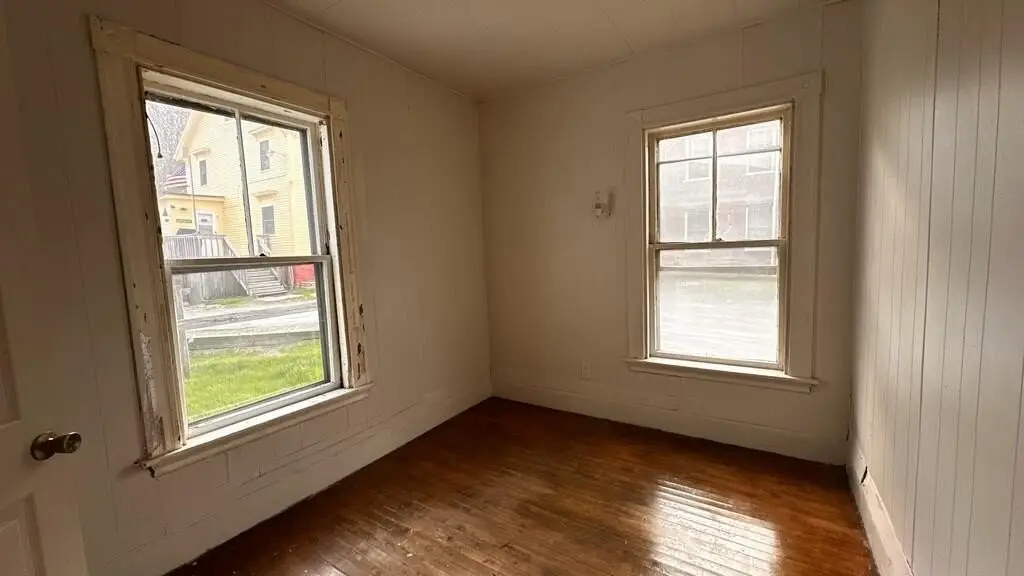
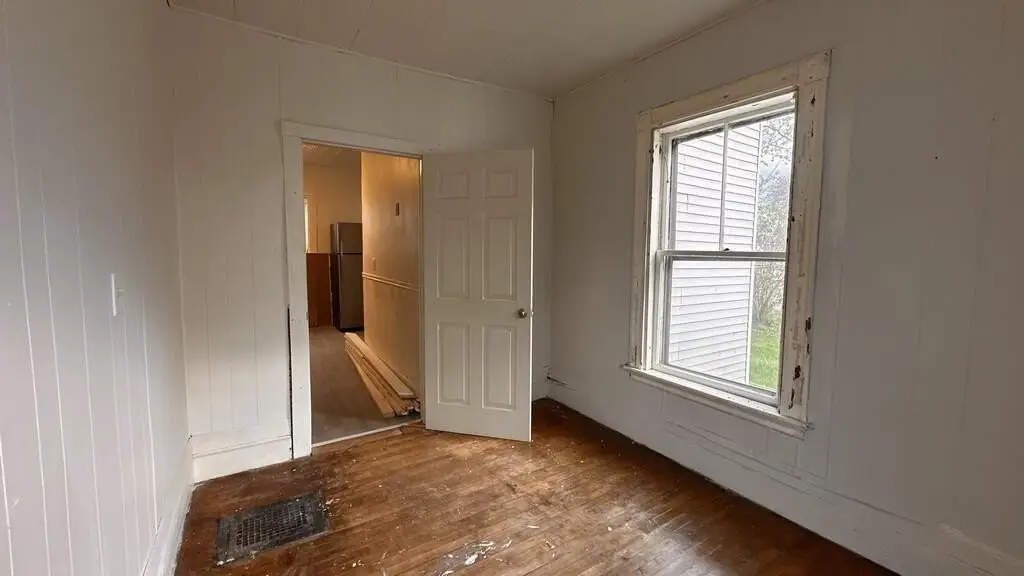
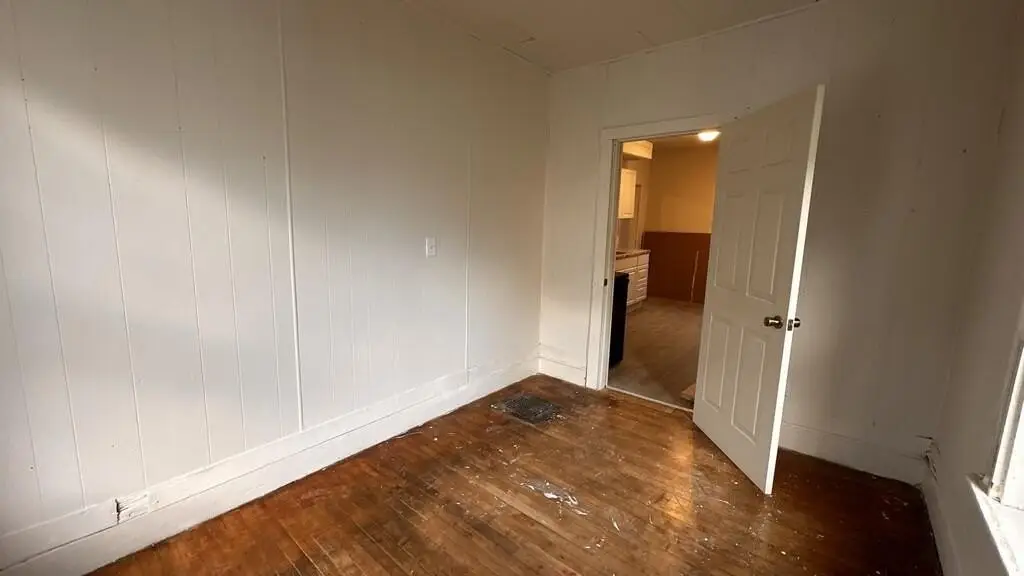
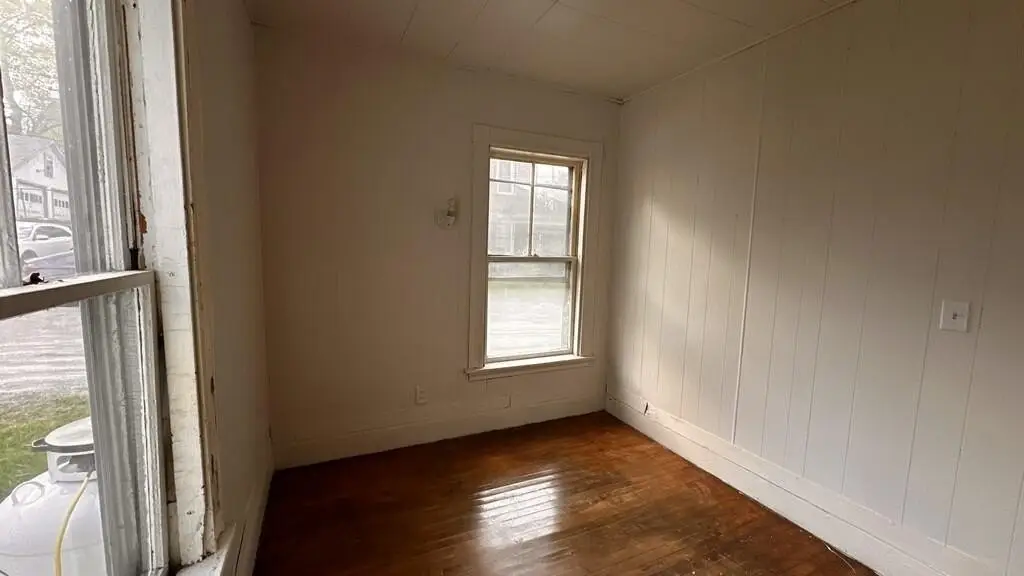
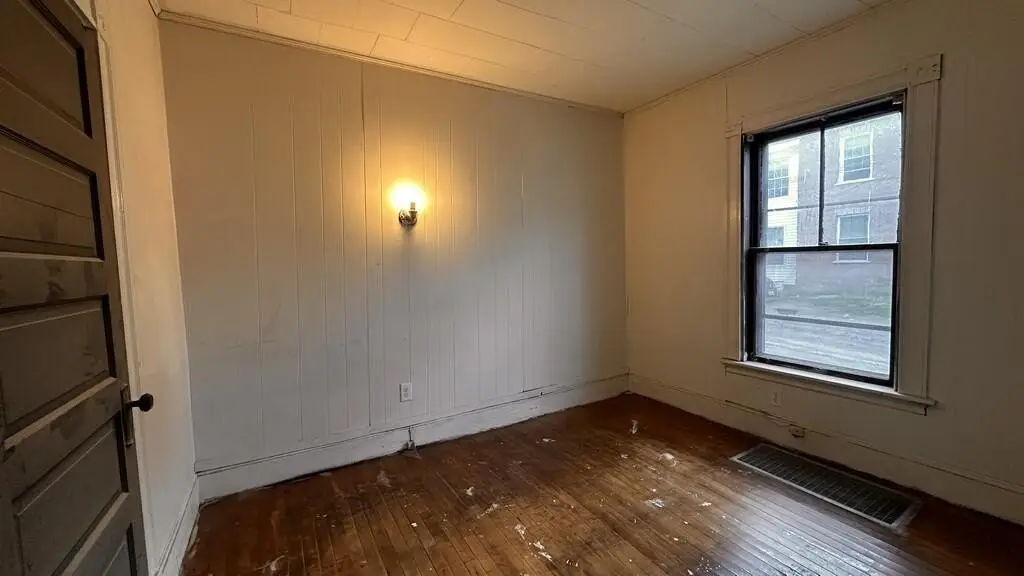
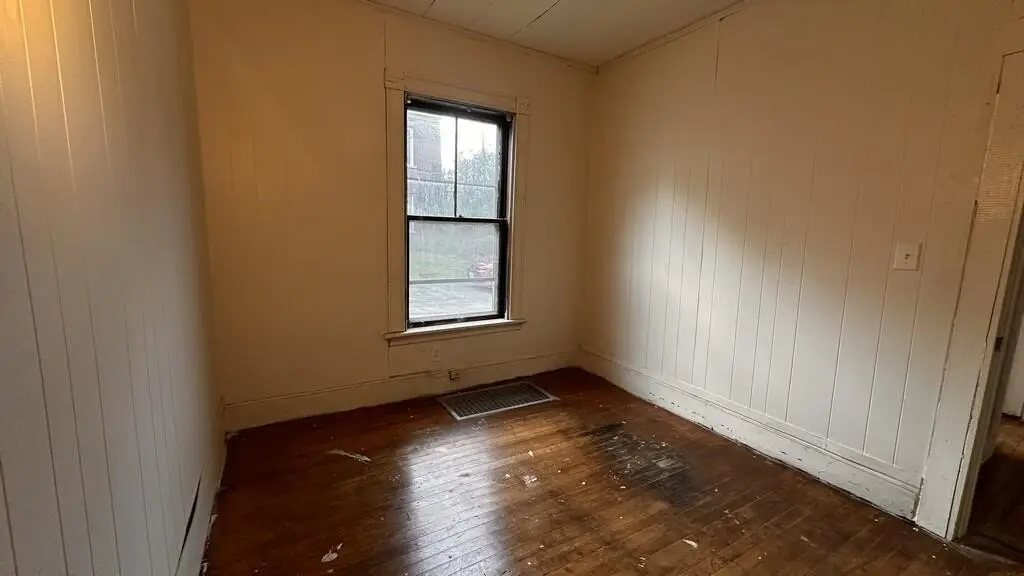
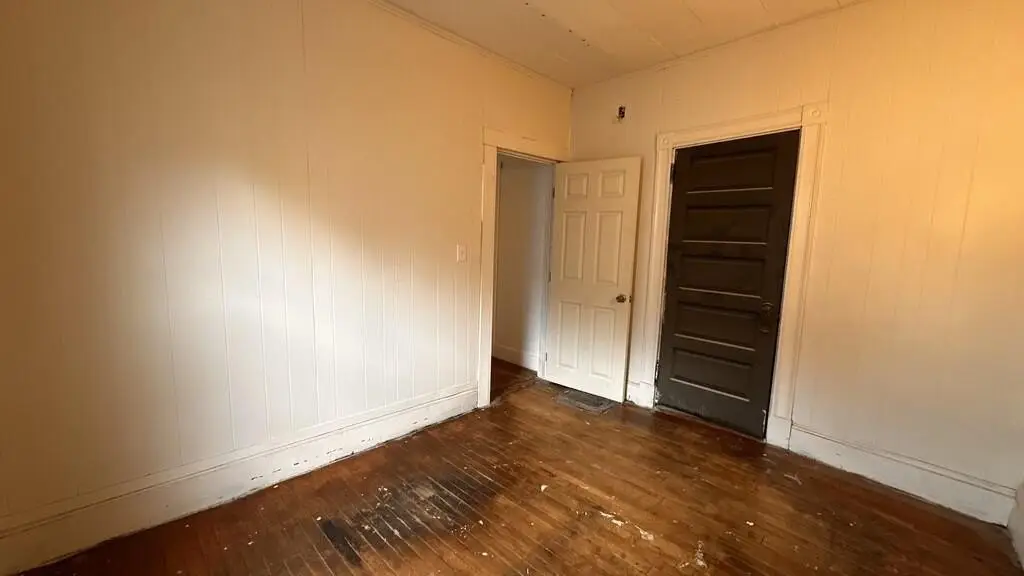
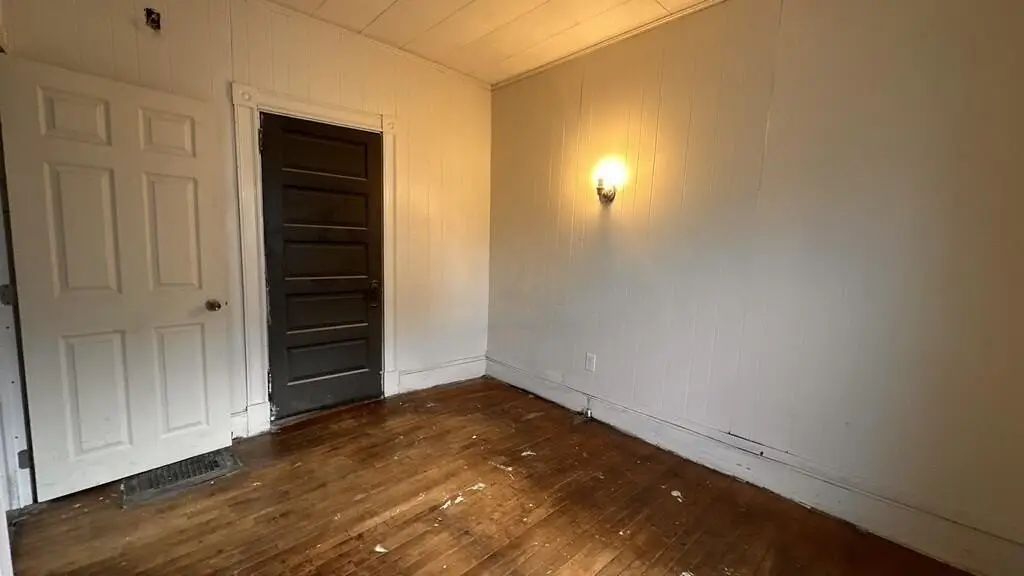
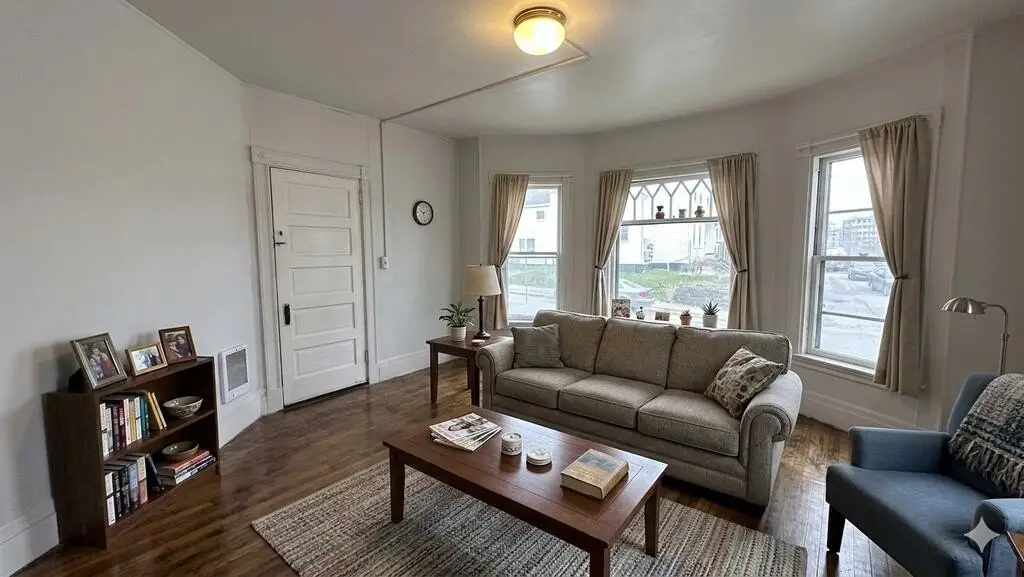
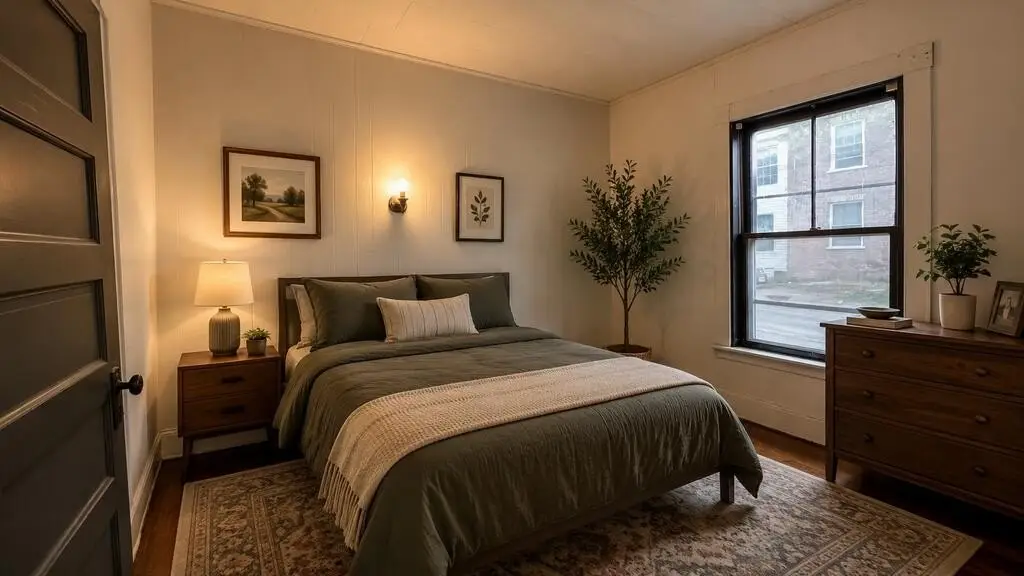
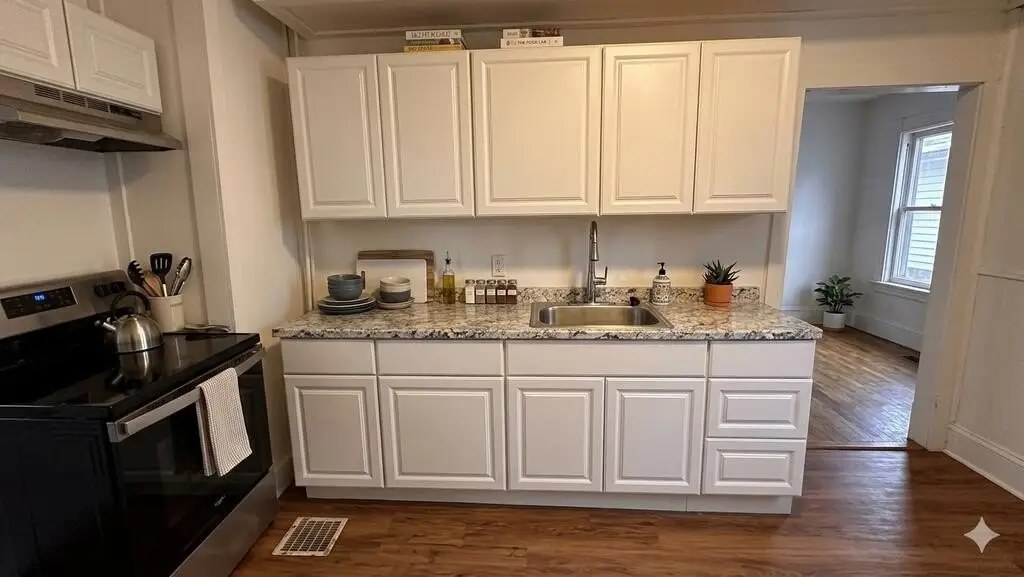
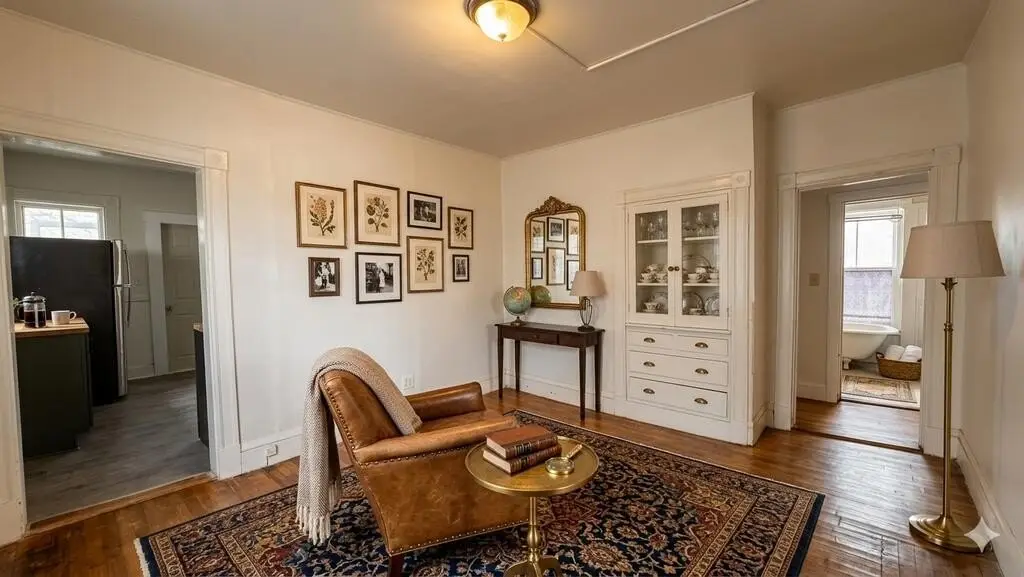
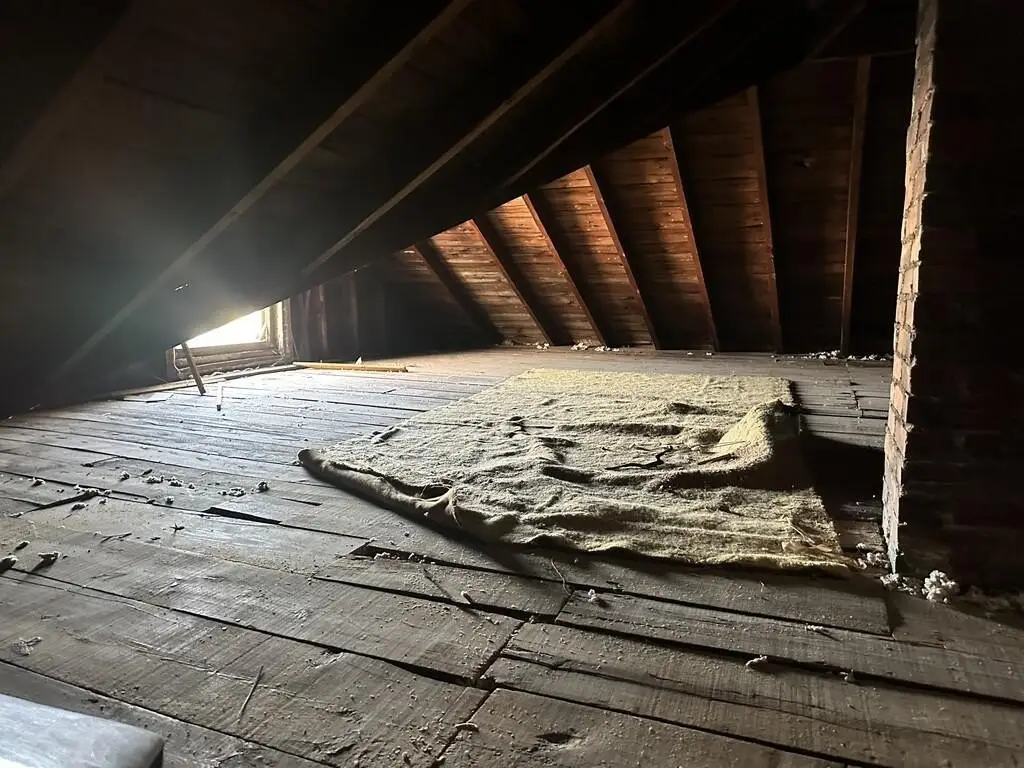
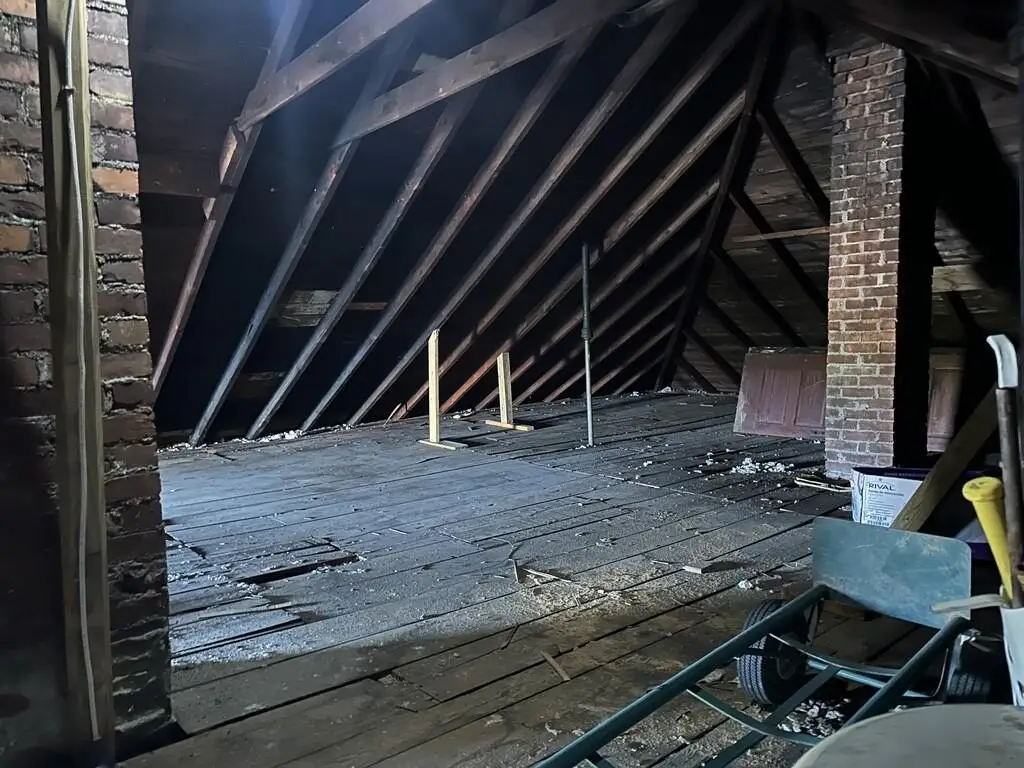
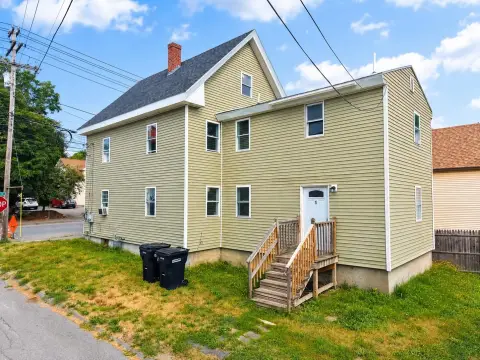
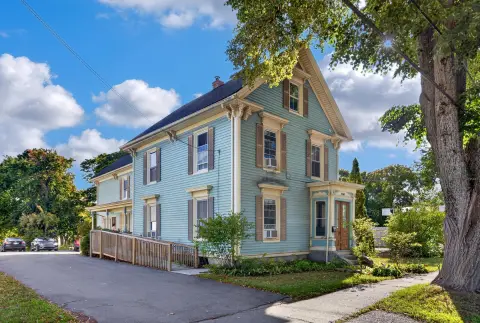
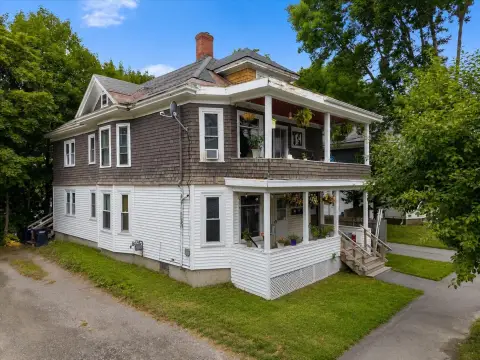
This Colonial-style duplex, built in 1900, contains 2,008 square feet on a 0.09-acre lot. The wood-frame building has vinyl siding, hardwood and linoleum flooring, a shingle roof, two bathrooms, and a basement. The lower level has been recently renovated and requires minor finishing work, while the upper level is occupied by a long-term tenant. The property also includes a deck and is served by public water and public sewer.
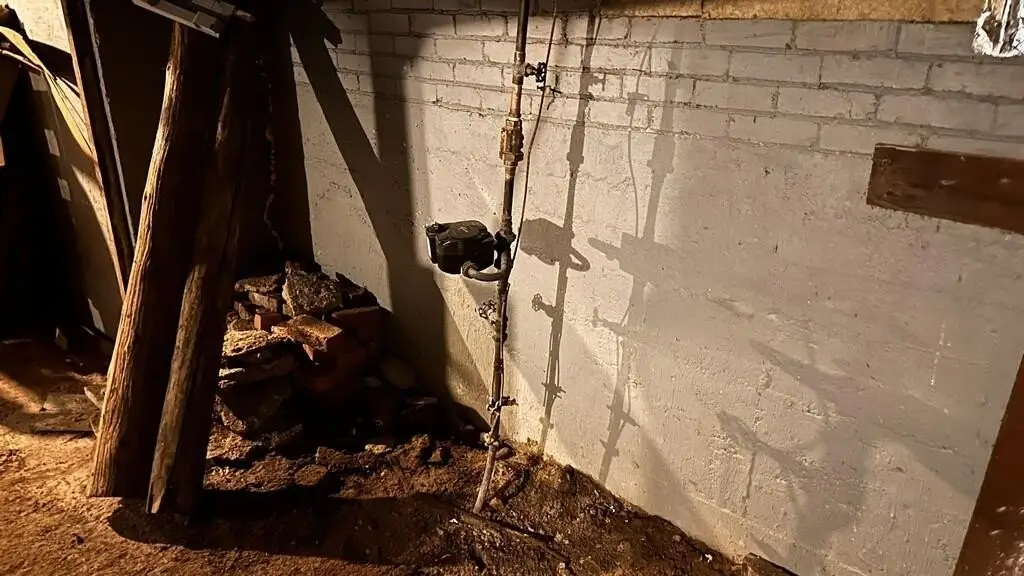
Located at 16 Walter Street in Bangor, the property is within walking distance of the Waterfront, the Cross Center, and downtown dining. It also sits along a major bus route. Heating is provided by an oil-fired forced-air system, and the property is positioned directly on a natural gas line. Residential zoning supports its existing duplex configuration.
Located at 16 Walter Street in Bangor, the property is within walking distance of the Waterfront, the Cross Center, and downtown dining. It also sits along a major bus route. Heating is provided by an oil-fired forced-air system, and the property is positioned directly on a natural gas line. Residential zoning supports its existing duplex configuration.
Key Highlights
- 2,008‑square‑foot duplex on a 0.09‑acre lot
- Lower level recently renovated with minor finishing work remaining
- Wood‑frame Colonial built in 1900 with vinyl siding and shingle roof
Financial Insights
Estimated NOI and Cap Rate
NOI / Yr
$18,402
Cap Rate
7.08%
Suggested Prices Based on Cap Rates
Cap Rate 5%
$368,040
$368.0K
Cap Rate 7%
$262,886
$262.9K
Cap Rate 9%
$204,467
$204.5K
Market Conditions
NOI Build-Up for 2,008 SF
Gross rent
$27.7K $13.80/SF
− Vacancy
−$1.4K −$0.71/SF
EGI
$26.3K $13.09/SF
− OpEx
−$7.9K −$3.93/SF
NOI
$18.4K $9.16/SF
Area
Penobscot County, ME
Vacancy
5.13%
Lease Rate
$13.80 /SF/Yr
Expense Ratio
30.00%
Simulate Cap Rate and NOI
Suggested Prices Based on Cap Rates
Cap Rate 5%
$368,040
Cap Rate 7%
$262,886
Cap Rate 9%
$204,467
Alternative Uses
Best Use
Multifamily LT 5
$262.9K
$230.0K – $306.7K
NOI $18,402 @ 7.0% cap · market cap 7.08%
Second Best
Apartment 5plus
$241.8K
$211.6K – $282.1K
NOI $16,925 @ 7.0% cap · market cap 6.51%
Theoretical Best
Office A
$648.5K
$567.5K – $756.6K
NOI $45,397 @ 7.0% cap · market cap 17.47%
Zoning and permitted uses should be independently verified with authorities.
How Realmo checks its estimates
Property Analytics
Unlock full access to Insights
Subscribe to Realmo Intelligence
Open Analytics
Current Use
Lease Details
Yes
Utilities to site
Location Intelligence
Trade Area within ½ mile
893
Businesses Nearby
Explore this area
Business Placement
Demographics for 04401, ME
44,608
Population
20,932
Households
2.1
Avg Household Size
40
Median Age
37%
College-Educated
96%
High-School Grad
100.1 sq mi
ZIP Area
446
Density / Sq Mi
$66,136
Median Household Income
$40,863
Median Earnings
$1,048
Median Rent
$229,600
Median Home Value
Check the figures for this property
Cap Rate, Value Estimation, Potential NOI and more
View Realmo Analytics
Market
Vacancy Rate% for Multifamily in Northeast region

Questions? Ask Rey
Realmo’s AI knows this listing — price, zoning, demand, history. Ask anything.





Frequently Asked Questions
What type of property is this?
Duplex - Colonial two-unit property with public water, public sewer, and a rear deck in Bangor.
Where is this duplex located?
The property is located at 16 Walter Street Bangor, ME.
What is the asking price?
The asking price for this property is $259,900.
What are key features of this property?
This property features: 2,008‑square‑foot duplex on a 0.09‑acre lot; Lower level recently renovated with minor finishing work remaining; Wood‑frame Colonial built in 1900 with vinyl siding and shingle roof


